Some folks have complained about the loss of GDP over the last five months and questioned whether the shutdowns have been worth the price. While people often toss around huge numbers in the trillions of dollars as the cost of the shutdown, these big numbers are often both inaccurate and misleading.
Measuring Lost GDP
The first place to start is getting a measure of lost GDP. This is fairly straightforward. We can just apply a 2.0 percent growth projection (approximately the projection from the Congressional Budget Office) and apply it to GDP for the 4th quarter of 2019. The difference between this projection and actual GDP for the first and second quarters gives a reasonable approximation of the cost of the shutdown for the first two quarters. There will be continuing costs going forward, but these are at least as much due to fear of the pandemic, as the impact of ongoing shutdowns. (Air traffic has been running at 25 to 30 percent of year ago levels, even though no restrictions prevent people from flying.)
This simple calculation shows a combined loss of GDP for these quarters of $645 billion measured in 2012 dollars, which would be roughly $745 billion in today’s dollars. That comes to a bit less than $2,300 per person.
If this sounds less than the numbers often tossed around, this is because we generally annualize our GDP numbers. This means that numbers show how much production/spending we would have if the economy kept at the same pace for a full year. As a result, our second quarter GDP showed the economy falling a 32.9 percent annual rate in the second quarter, but it actually only shrank by roughly 8.0 percent. To be clear, this is still a very large loss of output, but it is probably considerably less than many people had envisioned.
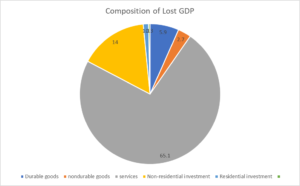
Source: Author’s calculations, see text.
Next, it is worth getting a better handle on where this drop in output came from. The figure above shows the breakdown between consumption, investment, and government expenditures. The striking part of this figure is the extent to which the decline in spending on consumer services accounts for the bulk, almost two-thirds, of lost output. This sector ordinarily accounts for less than 45 percent of GDP.
Before looking at consumer services more closely, it is worth commenting on the relatively smaller declines in other areas. The drop in investment means that we will be somewhat less wealthy in the future because we invested at a slower rate due to the shutdowns. While that is a loss to the economy, any reduction in future productivity due to lost investment is likely to be swamped by the effective gains in productivityassociated with increased telecommuting and other changes due to the crisis. So, as a general rule, more investment is better than less investment, but the enduring reduction in work expenses due to changes made during the pandemic will far more than offset the impact of this lost investment on productivity.
There was very little change in residential investment as a result of the shutdowns. While construction did slow when the shutdowns were in place most strongly in March and April, it has been close to normal in the months since then, as demand for housing has remained strong. This means we will not be seeing any shortages of housing due to the pandemic.
It turns out that there has been little net change in government expenditures as a result of the shutdowns. A modest reduction in federal expenditures was mostly offset by an increase in expenditures at the state and local level. It is important to remember that these data refer to actual expenditures on goods and services by the government. While they would include payments for education and hospital care, they exclude transfer payments such as unemployment benefits or the $1,200 per person pandemic checks.
Turning to consumption, there were modest declines in goods consumption, but much of this is likely linked to work-related expenses. In the case of the decline in durable goods consumption, more than half is explained by reduced spending on cars, jewelry and watches, and luggage. These are mostly expenditures that are work-related. The other major drop was in therapeutic appliances and equipment, like eyeglasses. This is an important issue, that I will come back to shortly.
There was a small drop in consumption of nondurable goods, where a large increase in spending on food purchased for home consumption almost offset sharp declines in spending on gasoline and clothes. These drops are clearly due in large part to lower work-related expenses. (It is worth noting that spending on newspapers and periodicals was more than 20 percent higher in the second quarter than it had been in the 4th quarter of 2019.)
The real story of the GDP plunge is in services and it is not hard to guess which ones. The ones involving work-related expenses all saw sharp declines. Spending on “personal care services,” which involves items like hair salons and dry cleaning, was down by 77 percent from the fourth quarter of 2019 to the second quarter of 2020. Transportation services were down by 41.3 percent, with public transportation seeing a falloff of more than 80 percent.
The second major category involves recreation and entertainment spending. Spending on recreation services, which includes things like amusement parks, concerts, and movies, was down 58.8 percent. Spending on restaurants and hotels was down 40.1 percent.
The third major category was health care, with spending down by 25.3 percent. The sharpest decline was in areas like physicians’ offices and dental services.
How should we think about these areas of lost consumption? The first category of work-related expenses is probably not a big loss. (I know everything is this category is not directly work-related, but most of the decline is.) If people spend less money on transportation because they aren’t driving or taking the bus to work, that is not an obvious loss in their well-being.
The second category involves activities that people enjoy doing. For several months they have not been able to go to restaurants and movies, visit with friends and family members, or engage in other normal activities. It is possible to see these things as frivolous, and that might be right compared to dying from the coronavirus, but we are only alive for so long. If we can’t do the things we enjoy and see people we care about, for six months or a year, that is a big deal.
Finally, we have the category of health care services. Much of this involves things like putting off a checkup or a teeth cleaning. Most of the time, there will not be major consequences from a delay of a couple of months, but in some cases, there will be. A person who has to wait another three months to have a cancer detected or to discover they have a heart problem may suffer serious and lasting health damage.
There is also the issue that fear of the pandemic may have discouraged people from getting necessary treatment or tests. For example, would a cancer patient, whose immune system is seriously compromised, feel comfortable going into a doctor’s office or hospital for tests? This is likely less an issue of shutdowns blocking care as opposed to the pandemic itself.
In fact, as we move into a period where most of the legal barriers have been removed or relaxed, this fear is likely to be the greatest issue going forward. People will not return to their former way of life until they can be sure that it is safe, and that means getting the pandemic under control.
I haven’t touched on the issue of schools thus far. This is huge for both the children and the parents. Undoubtedly, the shutdowns and school closings created hardships for many families, especially for mothers of small children. This may have been the largest cost of the shutdowns, as many families found themselves in cramped living spaces for long periods of time. We will likely get a better picture of the full impact some months down the road, when more data are available, but is likely that the shutdowns have been associated with more incidents of domestic violence.
From the standpoint of children, it seems clear that the lack of in-school instruction will further exacerbate the education gap between the children from lower income families and children from the upper middle class. The latter group is likely to have the resources to ensure that their kids receive adequate instruction. That is not the case with children from poorer backgrounds, where parents may be forced to work outside the home and they may not have access to computers or reliable Internet.
This could mean that these children will face lasting consequences in the form of lower graduation rates, lower rates of college completion, and lower incomes during their working careers. There is no easy short-term fix here. We can talk about programs to try to make up the lost ground for students from low- and moderate-income families, but realistically, this is not going to happen. We have failed miserably at trying to equalize educational opportunities over the last sixty years, we are not suddenly going to be able to turn things around in the next decade or so for the children currently in school.
To my view, the more promising route is to try to reduce the huge wage gaps we see now so that it matters much less who got the better education. If we had a minimum wage of $24 an hour and CEOs got paid $2-$3 million a year (with corresponding pay cuts for other top execs), the differences in opportunities would not condemn today’s children to a life of hardship. Unfortunately, few people in high level policy positions want to have this discussion.
Getting the Virus Under Control
While the cost of the shutdowns this spring were substantial, the cost of not shutting down much of the economy would have been enormous. When the country began to shut down in mid-March, the rate of infection was exploding. It was doubling every three or four days, and the reported rate was almost certainly a gross of understatement of the actual rate since testing was very limited. By early April, the pandemic was causing more than 2,000 deaths a day. The number peaked around 2,300 in mid-April and then began to fall gradually until early July when it was just over 500 a day. It since has risen again to more than 1,200 a day.
Had it not been for the initial lockdown in mid-March, it is almost certain that the infection would have continued to spread exponentially and the number of deaths would have grown along with the number of infections. There can be little doubt that the shutdowns saved many hundreds of thousands of lives in the United States, and quite possibly well over a million.
It is also important to recognize that many of the people who get the virus but don’t die, suffer lasting effects. There have been a number of accounts of people who have recovered from the disease but have enduring cognitive and/or physical problems. At this point, we do not have good data on the percentage of the people who get sick who will suffer lasting effects. But it would be wrong to ignore the consequences of the disease for people who get sick but don’t die.
Also, when we consider possible costs for restrictions in the United States going forward, it is important to realize the extent to which we are an outlier. Most other wealthy countries have largely succeeded in bringing the pandemic under control. The European Union (EU), in spite of a recent upsurge, has been averaging less than 7,000 cases a day. That compares to 60,000 in the United States, in spite of the fact that the EU’s population is 20 percent larger. The EU has been averaging around 150 deaths a day, compared to well over 1,000 in the United States.
Other wealthy countries generally had stricter shutdowns and smarter re-openings. As a result, the cost to their economies is likely to end up being considerably lower than in the United States. So, even if we decide that the benefits to public health may have been worth the cost to the economy, that doesn’t mean that we could not have had the same or larger benefits at a lower price, with good planning.
This article first appeared on Dean Baker’s Beat the Press blog.