If all carbon dioxide emissions were immediately and permanently shut off in the year 2020 (with 417ppm of CO2 presently in the atmosphere), when would the natural uptake of CO2 by Earth’s vegetation (primarily, at first) bring the CO2 concentration down to its “ancient” level of 280ppm?; and when would the average global surface temperature return to its 1910 level (the “ancient” level, with 0°C of global warming)?
By a series of inferences based on my previous calculations of global warming, I estimate that the answers to the above questions are:
1,354 years to reach 280ppm (after an abrupt CO2 shutoff in 2020);
even so, the global temperature will rise another +2.75°C by 300 years (year 2320), remain there for a century (till year 2420), then slowly reduce to the point of 0°C of global warming (the temperature in 1910, used as my baseline for “ancient” pre-warming conditions) in the year 3374.
Figure 1, below, summarizes these findings.
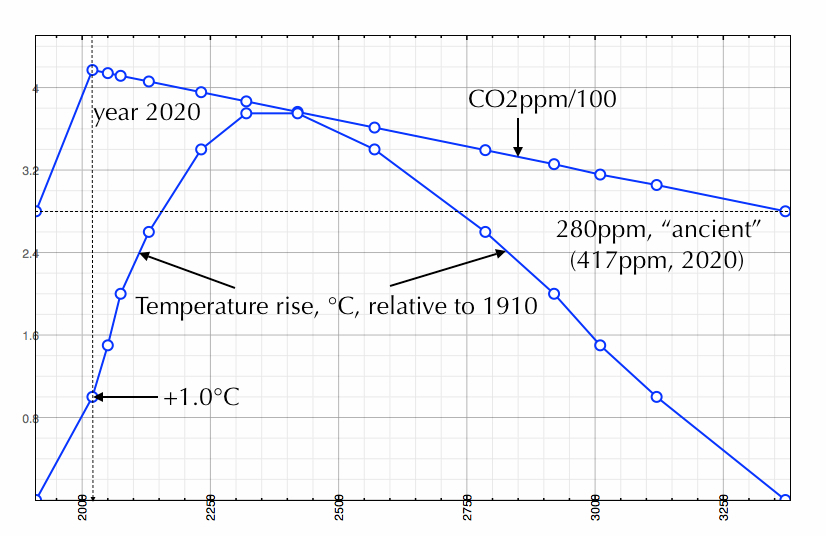
FIGURE 1: CO2ppm/100 and Relative Temperature after 2020 shutoff
What follows is an explanation of how I arrived at these conclusions. It is an exercise of inductive reasoning that I present in a detailed manner for the benefit of the reader’s understanding of my logic, and to give the reader every opportunity to challenge the arguments I advance.
I proceed by making inferences from incomplete data at my disposal, linked as necessary by physical assumptions that are clearly stated, to eventually arrive at projected histories of CO2 concentration in the atmosphere, and the relative temperature (with respect to that of 1910), for the 1,354 years between 2020 and 3374.
Data on Earth’s Biomass
Humanity today comprises only 0.01% of all life on Planet Earth, but over the course of human history our species has destroyed 83% of wild mammal species. [1]
The world’s 7.6 billion people [in May 2018] represent just 0.01% of all living things. Yet since the dawn of civilization, humanity has caused the loss of 83% of all wild mammals and half of plants, while livestock kept by humans abounds. The new work cited is the first comprehensive estimate of the weight of every class of living creature and overturns some long-held assumptions. Bacteria are indeed a major life form – 13% of everything – but plants overshadow everything, representing 82% of all living matter. All other creatures, from insects to fungi, to fish and animals, make up just 5% of the world’s biomass. Farmed poultry today makes up 70% of all birds on the planet, with just 30% being wild. The picture is even more stark for mammals – 60% of all mammals on Earth are livestock, mostly cattle and pigs, 36% are human and just 4% are wild animals. Where is all that life to be found?: 86% on land, 1% in the oceans, and 13% as deep subsurface bacteria. [2]
I assume that “today” 7.7 billion humans are 0.01% of Earth’s biomass, and that the “average” human weighs 65 kilograms (kg), which is equivalent to 143.4 pounds (lb).
From this, the mass of humanity is estimated to be 5.0×10^11 kg, and the totality of biomass is estimated to be 5.0×10^15 kg.
The estimated totality of biomass can also be stated as 5,000 giga-metric-tons. A metric ton (tonne) is equivalent to 1,000 kg.
The following table lists the quantitative estimates made from the data (above) regarding the Earth’s biomass (the NOTES column in the table indicate assumptions made). Yes, there are gaps and imperfections in the table, which reflect the incomplete knowledge I begin with.

Mass of CO2 in the Atmosphere
The mass of Earth’s atmosphere is 5.2×10^18 kg.
To a good approximation, Earth’s atmosphere is made up of diatomic nitrogen (N2), at 79%, and diatomic oxygen (O2) at 21%. The molecular weight of an N2 molecule is 28 (atomic mass units); and the molecular weight of an O2 molecule is 32 (atomic mass units). A conceptual “air” molecule is defined as having a molecular weight that is 79% that of N2 plus 21% that of O2; that value is 28.8 atomic mass units (AMU).
A carbon dioxide molecule has a molecular weight of 44 atomic mass units (the carbon atom contributes 12 AMU, the two oxygen atoms contribute 32 AMU, combined). So, a CO2 molecule is 1.526x heavier than an “air” molecule.
The concentration of CO2 in the “ancient” atmosphere was 280ppmv (parts per million by volume). The mass (weight) of that ancient (original or baseline) quantity of atmospheric CO2 is thus:
(280ppmv) x (5.2×10^18 kg) x (1.525) = 2.22×10^15 kg.
The mass (weight) of the CO2 presently in the atmosphere (417ppmv) is estimated by a simple ratio:
(417ppm/280ppm) x 2.22×10^15 kg = 3.31×10^15 kg.
The difference between the masses of CO2 today, and in the “ancient” (pre 1910) atmosphere, is the “excess” CO2 driving global warming. The quantity is:
(3.31×10^15 kg) – (2.22×10^15 kg) = 1.09×10^15 kg.
That is 1,090 giga-tonnes.
A second route to estimating the mass of CO2 in the atmosphere is as follows.
Modeling of the huge CO2 spike that occurred 55.5 million years ago and that produced the Paleocene-Eocene Thermal Maximum (PETM) was described in [2], drawing on work cited in [3] and [4].
5,000 billion tonnes of carbon were quickly injected into the model atmosphere, producing a concentration of 2,500ppmv of CO2. The modeling showed the excess CO2 being cleared from the atmosphere by a variety of processes, down to a level of about 280ppmv by 200,000 years.
I interpreted the statements about this modeling, in both [3] and [4], to mean that 5,000 billion metric tonnes of carbon (which happened to be bound in carbon dioxide molecules) — but not 5,000 gigatons carbon dioxide — were injected into the model atmosphere.
The ratio of the molecular weight of carbon dioxide, to the atomic weight of carbon is 44/12 = 3.667.
The quantity of injected CO2 (2,500ppmv) in that model is then:
(3.667) x (5,000×10^9 tonnes) x (1,000 kg/tonne) = 1.834×10^16 kg.
By simple ratios I estimate the masses of CO2 at both 280ppmv and 417ppmv:
(280ppmv/2500ppmv) x (1.834×10^16 kg) = 2.05×10^15 kg,
(417ppmv/2500ppmv) x (1.834×10^16 kg) = 3.06×10^15 kg.
Note that by the first method of estimating these masses I arrived at:
2.22×10^15 kg, at 280ppmv,
3.31×10^15 kg, at 417ppmv.
The agreement between the two methods is heartening. So, continue.
Notice that the mass of CO2 per ppm is:
1.834×10^16kg/2500ppm = 7.34×10^12kg/ppm; equivalently 7.34giga-tonne/ppm.
Lifetime of CO2 in the Atmosphere
The modeling of the PETM described in [2], [3] and [4] showed that after about 10,000 years after the “quick” CO2 injection, the concentration had been reduced to about 30% of its peak level, so to about 750ppm.
This means that the mass of atmospheric CO2 was reduced by 12,840 giga-tonnes (from 18,340 giga-tonnes to 5,500 giga-tonnes) over the course of 10,000 years.
Assuming that this reduction occurred at a uniform rate (linearly) implies that the rate was -1.284 giga-tonne/year, or -1.284×10^12 kg/yr.
The Earth during the PETM (55.5 million years ago) and the Eocene (between 56 and 35 million years ago) was ice-free. The Arctic was a swamp with ferns, Redwood trees and crocodiles; and the Antarctic was a tropical jungle. The quantity of vegetation over the surface of the Earth must certainly have been at a maximum.
Roughly half of the CO2 injected into the model of the PETM atmosphere (mentioned earlier) was drawn out by a combination of photosynthesis, uptake by the oceans, and some dissolution of seafloor sediments (chalk deposits), by 1,000 years. About 30% remained at 10,000 years, and that was further reduced (to about 280ppm, or 11% of the 2,500ppm peak) by 200,000 years by the processes of weathering of carbonate rocks, and then silicate rocks.
If the linear reduction rate of -1.284 giga-tonnes/year (estimated for the first 10,000 years of CO2 reduction during the PETM) were operative for the next millennia or two, the excess 1,090 giga-tonnes of CO2 presently in the atmosphere could be cleared down to 280ppm within:
(1,090 giga-tonnes)/(1.284 giga-tonne/year) = 849 years.
However, since 13 million years ago Antarctica has been in a deep deep freeze; and the Arctic has also been a region of deep cold, ice, and minimal vegetation. Also, “since the dawn of civilisation, humanity has caused the loss of 83% of all wild mammals and half of plants.” [1]
So this combination of natural and anthropogenic reductions of Earth’s vegetation from it’s peak during the Eocene would mean that the process of extracting CO2 from the atmosphere by photosynthesis will be slower. For the moment, I assume at half the rate given earlier, or -0.642 giga-tonnes/year. At that rate, clearing the current CO2 excess (linearly) would take 1,698 years.
In [5] I described my model of how average global surface temperature can be influenced by the exponential decay of CO2 in the atmosphere, after an abrupt and permanent cessation of CO2 emissions. I call the time constant (parameter) used in the exponential function that models the longevity of CO2 in the atmosphere, it’s “lifetime.” In [5], I showed a number of post-shutoff temperature histories, each characterized by a specific value of the lifetime parameter, which in mathematical jargon is called the “e-folding time.” The exponential function is reduced to 36.79% of its peak value when the elapsed time is equal to the e-folding time (e^-1).
The case of the e-folding time being 10,000 years (in my model) has the excess CO2 cleared out of the atmosphere by 1,300 years after the abrupt shutoff of emissions (when global warming is at +1°C, as it is now). That “10,000 year case” is shown in Figure 3 of reference [5], and will be described further below.
It also happens that 10,000 years was found to be the time span required to reduce the CO2 concentration in the model PETM atmosphere to about 30% to 40% of its beginning peak value.
So, I infer that 10,000 years is a reasonable estimate of the lifetime parameter (e-folding time) for CO2 in the atmosphere, and that the present excess of CO2 in the atmosphere (417ppm – 280ppm = 137ppm) would be cleared — if there were an immediate and permanent cessation of emissions — within about 1,300 years, which is similar (in this speculative modeling) to the 1,698 years clearing time gotten by halving an estimated clearing rate during the PETM, above.
A linear rate of decrease of 137ppm over 1,300 years would be -0.11ppm/year (this number will be further refined below).
Reduction of excess CO2 concentration after Abrupt Shutoff
(given a 10,000 year e-folding parameter)
Using the “10,000 year case” post-shutoff temperature change history, just noted [5], the following is observed:
The global temperature relative to “now” (2020, at +1°C) is:
above +2.75°C, at 300 to 400 years (net >3.75°C),
above +2.4°C, at 212 to 550 years (net >3.4°C),
above +1.6°C, at 110 to 766 years (net >2.6°C),
above +1.0°C, at 55 to 900 years (net >2°C),
above +0.5°C, at 30 to 1,100 years (net >1.5°C),
above +0°C, at 0 to 1,100 years (net >1°C).
200 years after the temperature overshoot dips below +0°C (below the 1°C of global warming above “ancient” we have now), further cooling returns the global temperature to its level in 1910 (“ancient,” as used here). This is the behavior, over a span of 1,300 years, of the “10,000 year case” calculated in reference [5].
So, I assume that a CO2 “lifetime” of 10,000 years (e-folding time parameter) would result in a reduction of the atmospheric concentration of CO2 from 417ppm (“now”) to 280ppm (“ancient”) in about 1,300 years. That would be a 67.2% reduction of concentration down to a level of 32.8% of the present peak; a linear rate of decrease of 137ppm/1,300years = 0.105ppm/yr (this number will be further refined, below).
Earlier (above) I had found that the mass of CO2 per ppm is:
7.34×10^12kg/ppm, equivalently 7.34giga-tonne/ppm.
If so, then the weight of CO2 removed per year (at -0.105ppm/yr) is:
7.71×10^11kg/yr, equivalently 0.771 giga-tonnes/yr.
The present excess of CO2 is 1,090 giga-tonnes. Clearing it in 1,300 years would imply a uniform (linear) removal rate of 0.839 giga-tonnes/yr.
I will average the two estimates just given for the CO2 removal rate, to settle on:
0.805 giga-tonnes/yr = 8.05×10^11kg/yr
as the CO2 removal rate.
Earlier (above) I found the mass of the present excess of CO2 in the atmosphere to be 1,090 giga-tonnes. It would take 1,354 years to clear away that excess, given a uniform removal rate of 0.805 giga-tonnes/yr.
That reduction of 137ppm over 1,354 years implies a uniform rate of -0.1012ppm/yr.
Earlier (above) I found the total mass of Earth’s plants to be 4,100 giga-tonnes, equivalently 4.10×10^15 kg. The present excess of atmospheric CO2 (1,090 giga-tonnes) is equivalent to 26.6% of the present cumulative mass of all of Earth’s vegetation (plants). The uptake per year is equivalent to 0.0196% of the current total mass of Earth’s plants.
CO2 uptake occurs within the continuing carbon cycle of:
– carbon dioxide absorbed by plant photosynthesis,
– plants consumed as food by animals (heterotrophs),
– organic solids and wastes absorbed by the soil (decay, nutrients, peat, oil, coal),
– carbon dioxide absorbed by the oceans and used to make shells and corals,
– organic gases emitted to the atmosphere (like methane, CH4, which is soon oxidized to CO2 and water vapor),
– re-release of plant-bound carbon to the atmosphere by wildfires,
– mineralization of CO2 by the weathering of carbonate, and then silicate rocks
From “final” quantities and rates determined in all the above, the following projected histories of the reduction of CO2 concentration (in ppm), and global warming (average global temperature excursion above its level in 1910), after an abrupt cessation of CO2 emissions “now,” are determined and tabulated. This is my estimation of the 1,464 year global warming blip projected to occur between 1910 and 3374.
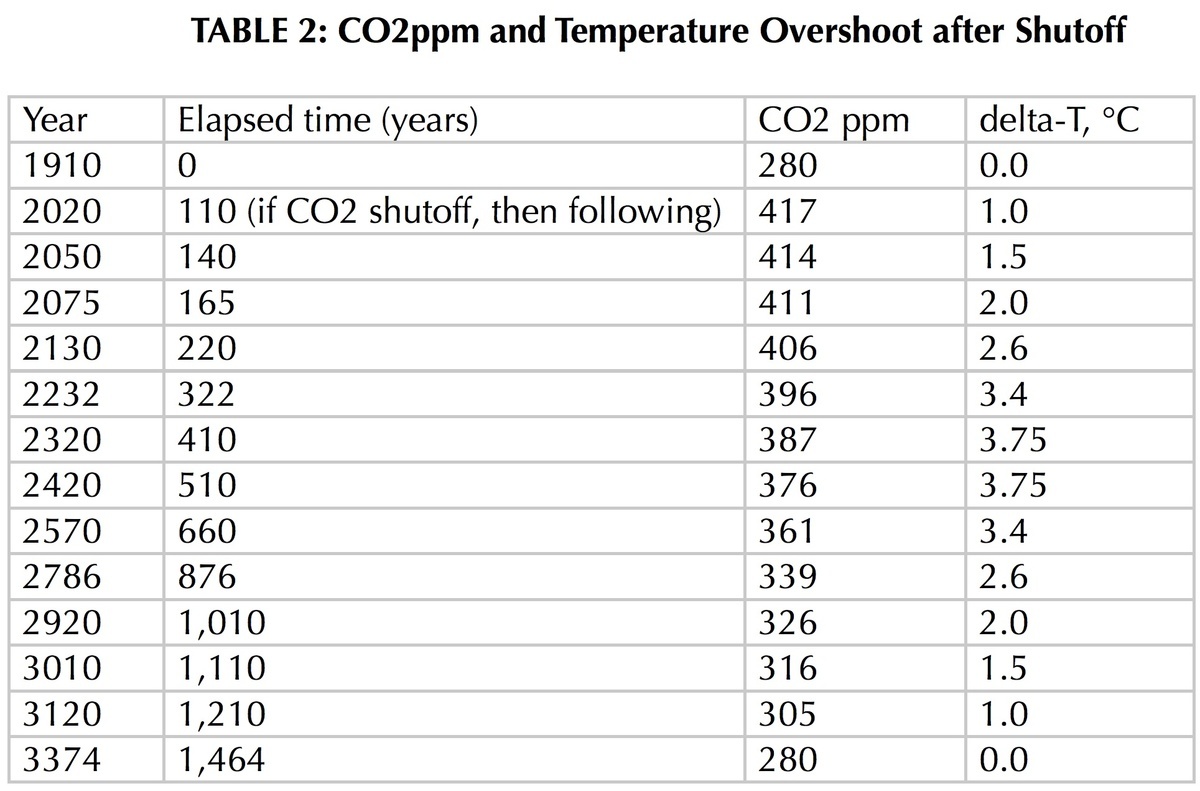
Figure 1, at the top of this report, is a graph of this table.
It is important to note that the conclusions of inductive reasoning — as is the case with this exercise — are viewed as supplying some evidence for the truth of the conclusion. They are not definitive as is the case with proofs by deductive reasoning.
In other words, I did the best I could with what I have. Only the unrolling of the future can supply us the definitive answers.
Notes
[1] Humans just 0.01% of all life but have destroyed 83% of wild mammals – study
[2] Ye Cannot Swerve Me: Moby-Dick and Climate Change
15 July 2019
https://manuelgarciajr.com/2019/07/15/ye-cannot-swerve-me-moby-dick-and-climate-change/
[3] Global Warming 56 Million Years Ago, and What it Means For Us
30 January 2014
Dr. Scott Wing, Curator of Fossil Plants,
Smithsonian Museum of Natural History
Washington, DC
[1:44:12]
[4] CO2 “lifetime” in the atmosphere
National Research Council 2011. Understanding Earth’s Deep Past: Lessons for Our Climate Future. Washington, DC: The National Academies Press.
Figure 3.5, page 93 of the PDF file, page numbered 78 in the text.
https://doi.org/10.17226/13111
[5] Global Warming and Cooling After CO2 Shutoff at +1.5°C
20 June 2020
https://manuelgarciajr.com/2020/06/20/global-warming-and-cooling-after-co2-shutoff-at-1-5c/