Economic inequality in the US has ballooned since the early 1980s. Wage and salary growth at the top of the earnings distribution has significantly outpaced that at the bottom and middle, resulting in decades of unabated upward redistribution of income. The COVID-19 pandemic has exposed and exacerbated this divide. In addition to the immediate problems highlighted by the crisis, the growing chasm between the rich and everyone else has long-term implications for the nation’s social safety net, specifically for the continued solvency of the Social Security trust fund.
Previous discussions of Social Security’s sometimes overstated financial woes have tended to focus on the aging US population. Though demographic changes do present challenges for the program, preoccupation with retiring baby boomers has obscured the growing threat that income inequality poses to Social Security’s longevity. Dean Baker previously highlighted this issue in 2013, and we update some of those findings here. Unfortunately, data show that the problem has persisted, and that Social Security has suffered ongoing damage as a result.
High levels of income inequality undermine Social Security in a few ways. Upward redistribution means that a larger share of wage and salary income exceeds the taxable maximum set at $137,700 in 2020. This directly impacts revenue, as additional earnings flow to workers who make enough to exempt those earnings from the payroll tax, and fewer earnings flow to workers whose earnings are fully taxable. The payroll tax is the primary source of Social Security’s revenue, so the program suffers when more income shifts to those who make above the cap.
In 1983, the Greenspan Commission on Social Security Reform established a taxable maximum that subjected 90 percent of covered earnings to the Social Security payroll tax, leaving only 10 percent of earnings over the cap. Despite yearly adjustments to the cap itself (based on changes in the national average wage index), by 2018, upward redistribution increased the portion of wage and salary income above the cap to 16.9 percent, with just 83.1 percent of wage and salary income fully taxable. The share going over the wage cap is projected to rise further, reaching between 17.5 percent and 18.9 percent of wage and salary income in the next decade.
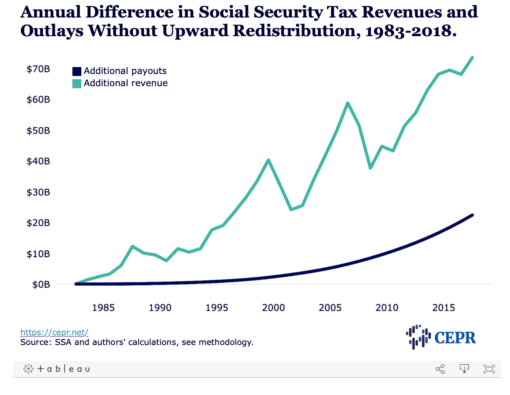
The Figure below shows the additional revenue and payouts that Social Security would have accrued had upward redistribution not taken place over the last four decades. Assuming a 5.0 percent nominal interest rate, if 90 percent of covered earnings had been subject to the payroll tax since 1983, the cumulative net gain for the trust fund would be at least $1,876 billion. This is equal to 10.5 percent of the $17,813 billion projected shortfall for the program’s 75-year planning period. Other models have suggested that the effects of uneven wage distribution may be much larger.
Upward redistribution also undermines the program’s finances indirectly. While top-earners have experienced tremendous gains, average earnings have failed to keep pace with productivity growth for decades. In just the last 13 years, productivity has grown at an average annual rate of 1.3 percent, while the real wage of the typical worker increased by an average of 0.3 percent per year. Had this divergence not occurred, that worker would be paid over 8 percent more; for a full-year, full-time worker at the median wage, this amounts to $3,500 annually. Underpaid workers are less likely to be able to absorb even a modest increase in the payroll tax. Moreover, while it’s impossible to know definitively how more commensurate take-home pay would affect the political landscape, stagnant wages likely make it more difficult to sell voters on a tax hike.
Considering these factors in tandem, it is clear that upward redistribution of income has played a role in the deterioration of Social Security’s finances. While ensuring the taxable ratio remained true to the 90 percent threshold set in the early 1980s would not eliminate the actuarial imbalance, it would delay the trust fund’s depletion, thereby improving the system’s financial outlook.
Going forward, one obvious way to further shore up the program would be to raise the taxable maximum so that a larger share of covered earnings were subject to the payroll tax. Currently, the taxable maximum only increases in years when Social Security grants beneficiaries a cost-of-living adjustment, which is based on the Consumer Price Index. Yet there is no reason why ceiling adjustments could not be recalibrated to be tied more directly to a constant, predetermined taxable ratio. Payouts to higher earners could also be attenuated by steepening the marginal income tax rate for benefit payments over a certain amount. This would not represent a dramatic departure from current practice, in the sense that revenue from taxes on Social Security benefits paid to relatively high-income beneficiaries has helped finance the system since 1984.
Social Security remains the most successful anti-poverty initiative in America’s history, and the public continues to hold it in high esteem. As the pandemic appears poised to jeopardize the retirement security of many Americans, safeguarding the program is of paramount importance. Policy makers must act swiftly to prevent upward redistribution from continuing to imperil its future.
Methodology
In the figure above, additional tax revenue was calculated by multiplying actual payroll tax contributions by the gap between 90 percent of wages and the actual amount of tax coverage divided by the share of wages covered:
(actual payroll tax contributions) * ((0.90 – share of wages covered)/ share of wages covered)
The share of wages covered can be found in Table 4.B1 of the Social Security Annual Statistical Supplement. Annual revenue can be found in Table VI.A3. of the Social Security Trustees Report. Additional payout calculations credit additional revenue to the earnings of workers whose lifetime income puts them above the 15 percent bendpoint and is taxed at a rate of 12.4 percent. They also reflect a 2.5 percent annual cost-of-living adjustment. Per the Social Security Averaging Formula, we assume that the higher payout increases the benefit basis for each cohort by 1/35th of the amount paid that year. This effect is cumulative, so that a cohort that had been paying more in taxes for 10 years will have seen their benefit basis increase by the additional amount paid in over the prior 10 years. Since payouts take place after revenue is received, the calculation assumes that this increase is phased in at a rate of 0.04 percent annually. This implies that after 25 years all beneficiaries will have been subject to the higher income threshold.
Hayley Brown is a Research Assistant at the Center for Economic and Policy Research.
Dean Baker is senior economist at the Center for Economic and Policy Research
This article first appeared on CEPR.