Testimony by Dr. Dean Baker, Senior Economist, Center for Economic and Policy Research to the House of Representatives, Rules Committee, April 30, 2019.
I want to thank Chairperson McGovern and Ranking Member Cole for inviting me to address the committee on issues related to Medicare for All. I will make three main points in my testimony.
1) The bulk of the cost of implementing a universal Medicare program will come from shifting payments for employer-provided health insurance to the government;
2) The amount of additional revenue required for a universal Medicare program will depend on the extent to which the cost of health care inputs (e.g. prescription drugs, medical equipment, physicians) can be brought in line with other wealthy countries;
3) Reduced costs can be associated with better care.
I will also make a few comments on the transition to a universal Medicare program, arguing that it is important that it not be done too quickly.
The Cost of a Universal Medicare Program
At the most basic level, proposals for Medicare for All, such as the Jayapal bill, involve making the government responsible for costs now paid by private insurers or as out-of-pocket payments by individuals. If we just project out these costs for the years 2021 to 2030, it would come to $33.4 trillion or 11.5 percent of GDP over this period.[1]
While this is very substantial by any measure, it becomes considerably more manageable on closer examination. Most immediately, the Centers for Medicare and Medicaid Services (CMS) projects that we will spend $3.9 trillion on insurers’ administrative costs and profits over this period. This comes to 27.9 percent of projected payments for services by insurers.[2] If we assume that a universal Medicare system would have administrative costs comparable to the current Medicare system, or the Medicare-type systems in Canada, the United Kingdom and elsewhere, administrative costs would be closer to 3.0 percent of payments to providers. This would save roughly $3.5 trillion over the course of the decade.
In addition to the direct administrative costs associated with our private insurance system, it also imposes substantial costs on hospitals, doctors’ offices, and other providers. They need people on staff to deal with a variety of different forms and billing practices. They also need staff to assist patients in dealing with insurers and their own billing. In addition, employers who provide health care benefits need to devote staff time and/or hire consultants both to select and administer plans and to assist workers in making claims and choosing plans.
These costs can be substantial. A 2003 study comparing administrative costs in Canada and the United States found that hospitals in the United States devoted 24.3 percent of spending to administrative costs compared to just 12.9 percent in Canada.[3] If we apply this difference of 11.4 percentage points to projected hospital spending for the decade, it comes to $2.1 trillion. Table 1 shows the impact of savings on administrative costs on the additional revenue needed to pay for a universal Medicare program.
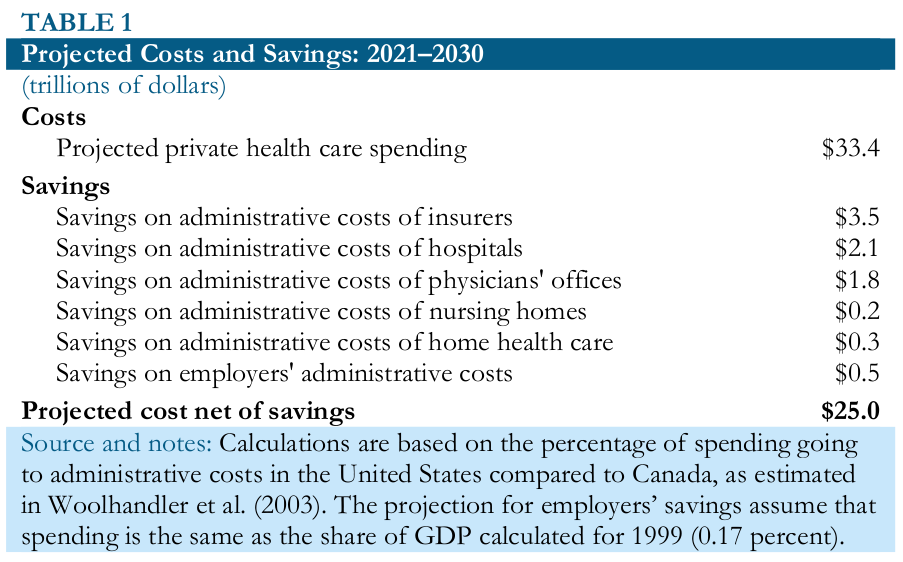
The total projected administrative savings comes to $8.4 trillion over the decade, leaving a net increase in spending of $25 trillion or 8.6 percent of projected GDP. While these estimates of potential administrative savings are necessarily inexact, there is good reason to believe they might on the low side. The calculations are all done in percentage terms. Since our per person health care costs are roughly twice as high as Canada’s, these calculations would still imply that US providers under a universal Medicare system would still spend twice as much on administrative costs as their counterparts in Canada.
The next adjustment to the additional spending needed is for increased utilization. A main goal of a universal Medicare system is to ensure that people have access to the care they need, regardless of their income. With almost 30 million people currently uninsured and tens of millions more under-insured, there are undoubtedly many people now who are not getting the care they need due to the cost.
While there is some research on the sensitivity of health care usage to price, it is difficult to assess the impact of such a large change. It is also important to note that because of the enormous skewing of health care costs, most health care spending now is attributable to people who have already reached deductible limits on private insurance or are under Medicaid, which picks up most of patients bills.[4] For these people, cost is not a constraint on usage.
To get a ballpark number on increased utilization, we can assume that people will increase their usage by roughly 10 percent if a universal Medicare system eliminated most cost constraints.[5] This implies an additional $2.5 trillion in spending over the decade.
Even under a universal Medicare system, people will still have some out-of-pocket expenditures for health care. At the least, we would still expect people to pay for items like Band-Aids, some non-prescription drugs, like aspirin, as well as optional items like non-essential cosmetic surgery. In Canada and the United Kingdom, out-of-pocket spending comes to an average of 1.3 percent of GDP. If we assume that a universal Medicare system in the United States is somewhat more generous, we can assume patients will pay an amount equal to roughly 1.0 percent of GDP, or $2.9 trillion over the course of the decade for out-of-pocket expenses or supplemental insurance.
Table 2 nets out these costs and compares them to projected employer payments for employer-provided insurance.
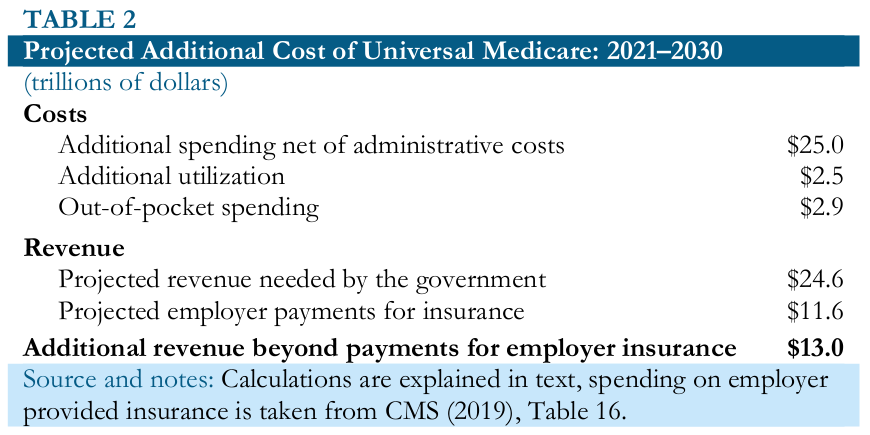
As can be seen, after adding in the expense for additional utilization and subtracting out a projection of out-of-pocket spending equal to 1.0 percent of GDP over the decade, the net amount of revenue needed is $24.6 billion over the decade or 8.5 percent of projected GDP. Projected employer payments for insurance come to $11.6 billion, or nearly half of this sum. While there are undoubtedly political issues associated with having these payments go to the government rather than private insurers, from the standpoint of workers, it likely makes little difference who their employer mails a check to.[6]
This leaves $13.0 trillion, an amount equal to 4.8 percent of GDP as the additional revenue that would be needed to cover the cost of a universal health care system. This is still a substantial amount of money, a bit less than the current size of the Social Security program, but this is before considering the cost side of the picture.
Lowering the Costs of Health Care Inputs
Just as we pay roughly twice as much per person for our health care as people in other wealthy countries, we also pay twice as much for most of our inputs, such as prescription drugs, medical equipment, and physicians’ services. By bringing these costs in line with costs in other wealthy countries, we can substantially reduce health care spending and the amount of additional revenue that would be needed to cover a universal Medicare program.
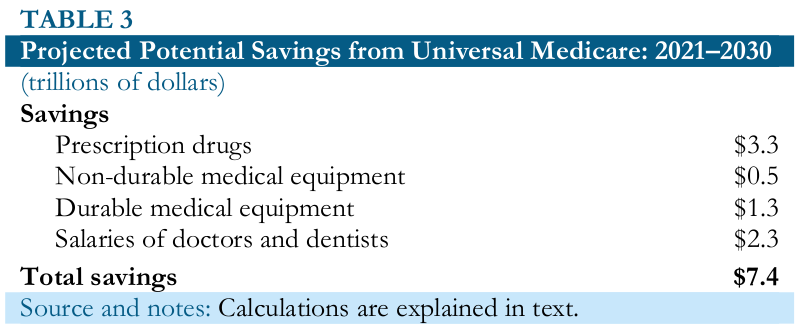
CMS projects that we will spend more than $6.6 trillion on prescription drugs over the course of the decade.[7] Other wealthy countries spend roughly half as much per person for prescription drugs as the United States.[8] In the United Kingdom, per person spending is less than 40 percent as much as in the United States. If the United States adopted similar rules on negotiations or price controls, presumably it would be able to pay a comparable amount for prescription drugs. This would imply savings of $3.3 trillion over the course of the decade.
It is worth noting that it is government policy that makes drugs expensive, specifically government-granted patent monopolies and related forms of protection. Without these monopolies, prescription drugs would almost invariably be cheap. It is rare that drugs are expensive to manufacture. In most cases, free market drugs would sell for less than 10 percent of their patent-protected price and often for less than 1 percent.[9]
The pharmaceutical industry undertakes roughly $70 billion in research annually, which must be paid for in some manner.[10] If we assume that the prescription drugs we bought in 2018 would have cost us roughly $80 billion if they sold in a free market without patents or related protections, we effectively paid $350 billion in higher drug prices for $70 billion in research by the industry. This suggests even greater opportunities for savings if, rather than giving patent monopolies, the government directly paid for prescription drug research with all new drugs being sold as generics. In addition to the savings on drugs prices, this route would also have the advantage that all research findings would be fully public, which could be made a condition of receiving the funding.
CMS also projects that we will spend more than $1 trillion on non-prescription drugs and non-durable medical products over the decade.[11] If these prices can also be brought down by 50 percent, that would save another $0.5 trillion over the course of the decade.
The projections assume that the country will spend $2.6 trillion on durable medical equipment over the decade.[12] These are items like MRIs and dialysis machines that cost far more to buy and use in the United States than elsewhere. This is also a situation comparable to that of prescription drugs, where the equipment would be relatively cheap in a free market, but the government makes it expensive with patent monopolies. If we assume prices can be reduced by 50 percent with negotiations and/or controls, it would save $1.3 trillion over the course of the decade.
Our doctors and dentists also get paid roughly twice as much as their counterparts in other wealthy countries.[13] With 900,000 doctors getting an average pay of close $300,000 annually, this comes to roughly $270 billion in 2018.[14] With 150,000 dentists earning average pay of $200,000 annually, this comes to $30 billion, for a total $300 billion for the two professions.[15] Adjusting for projected growth in spending in these areas, the ten year total is $4.5 trillion.[16] If US doctors and dentists were paid in line with their counterparts in other wealthy countries, the savings would $2.3 trillion over the course of the decade.
There are both political and practical reasons why it may not be desirable to push doctors’ and dentists’ salaries down to international levels. For example, many have incurred large debt in the course of their education. Presumably, if these professionals were to receive lower pay going forward, the government would also want to pay for much or all of the cost of their education. However, this would be a limited additional expense. If the federal government were to pay an additional $100,000 a year for the education of 60,000 medical and dental school students, it would come to just $6 billion annually or 0.03 percent of GDP.
Table 3 sums the potential savings in the categories discussed above.
The net additional revenue needed in this case is $5.6 trillion over the course of the decade or roughly 1.9 percent of projected GDP. This roughly equal to the projected increase in Social Security spending as a share of GDP over the years 2000 to 2030, as shown in Table 4.
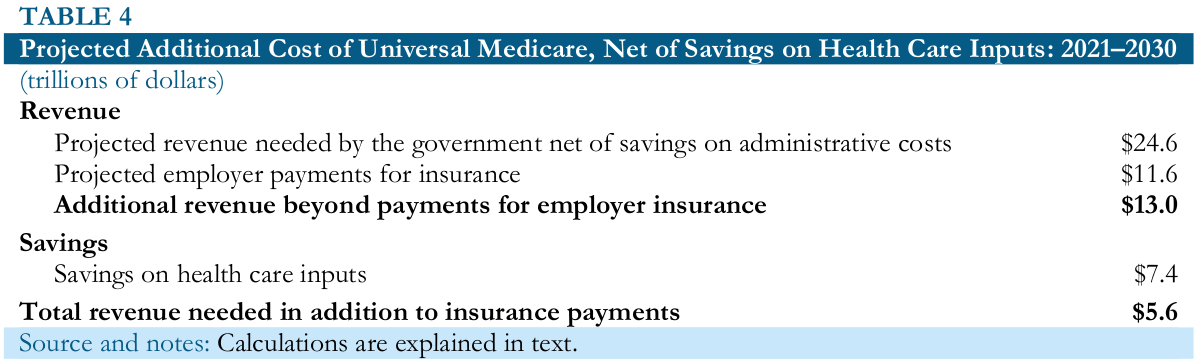
This is not to argue that the additional revenue needed or the projected costs savings would be easy to accomplish either practically or politically. However, it is important to recognize that these are plausible numbers, if we could get costs more in line with is paid in other wealthy countries, a universal Medicare system is certainly affordable. It would require substantial, but not unprecedented, tax increases. It is worth noting in this respect that if we look at low-cost health care systems, such as the one in the United Kingdom, we already spend enough on a per person basis in the public sector to fully cover the cost of its system.
Lower Costs Can Be Associated with Better Quality Care
In spite of the large gap between what people in the United States pay for health care and what people pay in other countries, we do not get better quality care.[17] Not only do we have shorter life expectancies and higher infant mortality rates than people in other countries, we also don’t do better by measures of disease treatment, such as care for people with heart conditions or survival rates from cancer. We pay a huge amount more to get outcomes in these areas that are not systematically better than in other wealthy countries. If we looked to go the route of a universal Medicare system, in addition to increasing access, there are also reasons for thinking that even people who already have insurance would get better care.
The first reason is an obvious one, patients and their families would have to spend many fewer hours dealing with bills and insurers. While I am not aware of any studies that measure the amount of time that people must spend dealing with bills and insurers, there is the obvious point that people are most likely to face this ordeal when they are in bad health. It is not good policy to make someone struggling with cancer to also have to contend with bills from a hospital and/or an insurance company that does not want to pay them.
However, as much we might want to believe the goodwill of insurers, it is a simple fact that they make more money by paying out less in claims. If they can find a way to avoid paying a claim, they will. We should not be forcing people in bad health, or their families, to contend with insurers who are trying to avoid paying claims.
In the same vein, the goal to persuade patients to shop around to better “consumers” of health care seems hopelessly wrongheaded. People do not want to shop around for the best insurance plan, which in most cases are quite hard to understand even for those who try.[18] They also are not generally well-prepared to shop around for the lowest priced procedures. A fascinating study of patients’ decisions on lower-body MRIs supports the notion that patients are not generally inclined to do comparative shopping when it comes to health care.[19]
Lower-body MRIs are a relatively standardized item, as compared to something like hip replacement surgery. Yet, the study found that patients typically choose a provider recommended by their doctor rather than a lower-cost alternative that was as close or closer to their home. If people are not prepared to do comparative pricing on lower-body MRIs, it seems unlikely that they will do comparative pricing on more complex procedures. We need to design policies based on the way people actually behave, not on how we might like them to behave.
The lower prices for prescription drugs and medical equipment, discussed in the last section, may actually lead to better outcomes in many cases. There is a very basic economic principle at stake here. When government intervention raises a price above the market price, it alters the incentive structure. Economists often make this point in terms of tariffs, such as the ones the Trump administration has recently put in place. These tariffs give consumers of items subject to the tariff incentives to misrepresent items in order to avoid paying the tariff. For example, The New York Times recently ran an article on how a shoe manufacturer is able to circumvent a 12.5 percent tariff on imported rubber soles.[20] The companies that benefit from a tariff will also use their political and legal power to extend and increase the tariff as much as possible.
This is the story of patent protection for prescription drugs, except instead of raising the price by 10 or 25 percent, the patent-protected price is typically several thousand percent above the free market price. In addition to the incentive this gives companies to use legal and political power to push for ever longer and stronger patents and related protections, it also gives them an incentive to promote their drugs as widely as possible, even in circumstances where it may not be helpful or could even be harmful.
The most famous incidence of the latter is the efforts by Purdue Pharma to promote OxyContin. It allegedly promoted it to doctors with the claim that it was not addictive. Needless to say, it would not have had the same incentive to push this opioid if it was selling at generic prices. This a major source of abuse in our medical system which would be eliminated if drugs were not granted patent monopolies and related protections.[21]
The Transition to Universal Medicare
A Medicare for All system of the type envisioned in the Jayapal bill is a huge step from our current system, which relies largely on private insurers. The list of transition problems that would arise is too long to address here. However, I would argue that it is essential that any move to such a system be done piecemeal since a quick changeover would virtually guarantee confusion and quite possibly lead to some people going without care.
Just to take an obvious point, there will almost certainly be some doctors who opt to remain outside the system. While the intention is to make this decision rare, the administrative and legal ability to prevent physicians from practicing outside the system is likely to be limited. If the claim is that people will be able to keep their doctors, in many cases this may prove not to be true if their doctors stay outside the system.
Raising taxes and/or lowering prices are also steps that are probably best done through time. If the government were to quickly assume the costs of more than half the health care system, and only raise the taxes to offset this spending over a period of years, we are likely to see a serious problem of inflation, as the government will be injecting more than $1 trillion a year of additional spending in the economy.
These and other issues will make the transition difficult. On the plus side, there are a wide range of policies that can be pursued that are both steps toward universal Medicare and offer immediate benefits in the short-term. For example, a wide range of policies that would lower the cost of prescription drugs would both provide immediate savings and make an eventual transition easier. In addition, if the government were to set aside funding for the development of new drugs to be sold as generics in certain areas (e.g. cancer and heart disease) it could begin to set us on a path toward publicly funded research and free market drugs and medical equipment.
We can also look to gradually add people to the Medicare program and improving it. For example, allowing people to voluntarily buy into the program would be a big step. We can also try gradually lowering the age of eligibility. If dropping it to age 55 or even 60 is too big a leap, a reduction to age 64 would be a great first step. This move would be made easier by the fact that many 64-year-olds are already on Medicare through Social Security disability, or alternatively receive Medicaid. This small step would both be appealing to people approaching Medicare age, while also calling attention to any problem incurred in adding more people to the program.
There are many ways to get from the current system to a universal Medicare system. The risk of trying to do it quickly are enormous, taking advantage of openings where they exist seems a much better route.
Notes.
[1] These calculations are taken from the Centers for Medicare and Medicaid Services (CMS). 2019. “National Health Expenditures Projections, 2018–2027.” Baltimore, MD: CMS. https://www.cms.gov/Research-Statistics-Data-and-Systems/Statistics-Trends-and-Reports/NationalHealthExpendData/Downloads/Proj2018Tables.zip, Table 1. Spending levels for 2028–2030 assume the same rate of growth projected for 2024–2027. All subsequent calculations make projections for these years in the same manner.
[2] Ibid., Table 2 and Table 3.
[3] Woolhandler, Steffie et al. 2003. “Costs of Health Care Administration in the United States and Canada.” N Engl J Med, 349:768–775. https://www.nejm.org/doi/full/10.1056/NEJMsa022033.
[4] In 2016, 5.0 percent of the population accounted for half of health care expenditures and the top 10 percent accounted for more than 70 percent of spending. See Agency for Healthcare Research and Quality. 2019. “Concentration of Health Expenditures and Selected Characteristics of High Spenders, U.S. Civilian Noninstitutionalized Population, 2016.” Rockville, MD: Agency for Healthcare Research and Quality. https://meps.ahrq.gov/data_files/publications/st521/stat521.pdf.
[5] For a discussion of the evidence on utilization and cost, see Pollin, Robert et al. 2018. “Economic Analysis of Medicare for All.” Amherst, MA: PERI. https://www.peri.umass.edu/publication/item/1127-economic-analysis-of-medicare-for-all, pp 22–32.
[6] There is an important point that employer-provided insurance is an important benefit that employers give workers. If workers got the same insurance regardless of where they worked, employers could not use the quality of their insurance as a way of attracting workers.
[7] The CMS projections (Table 11) only count retail spending on prescription drugs. The Bureau of Economic Analysis (Bureau of Economic Analysis (BEA). 2019. “National Income and Product Accounts.” Suitland, MD: BEA. https://apps.bea.gov/iTable/iTable.cfm?reqid=19&step=2#reqid=19&step=2&isuri=1&1921=survey) has data on total spending on prescription drugs (Table 2.4.5U, Line 121). For this calculation, the projection for spending on prescription drugs over the decade was multiplied by the ratio of BEA’s estimate of spending on all prescription drugs to CMS’s estimate of retail spending (1.24).
[8] OECD. 2019. “Pharmaceutical spending.” Paris, France: OECD. https://data.oecd.org/healthres/pharmaceutical-spending.htm.
[9] Collins, Simon. 2016. “1,000-Fold Mark-Up for Drug Prices in High Income Countries Blocks Access to HIV, HCV and Cancer Drugs.” The Body Pro, October 24. https://www.thebodypro.com/content/78658/1000-fold-mark-up-for-drug-prices-in-high-income-c.html.
[10] This figure is obtained by taking the National Science Foundation’s estimate for 2012 and increasing it in proportion to GDP growth between 2012 and 2018. National Science Foundation. 2012. “Business Research and Development and Innovation: 2012.” Arlington, VA.: National Science Foundation. https://www.nsf.gov/statistics/2016/nsf16301/#chp2, Chapter 2.
[11] This comes from CMS (2019), Table 12.
[12] CMS (2018), Table 15.
[13] Laugesen, Miriam J. and Sherry A. Glied. 2008. “Higher Fees Paid To US Physicians Drive Higher Spending for Physician Services Compared to Other Countries.” Health Affairs, Vol. 30, No. 9, pp. 1647–56. https://content.healthaffairs.org/content/30/9/1647.full.html.
[14] Kane, Leslie. 2018. “Medscape Physician Compensation Report 2018.” Medscape, April 11. https://www.medscape.com/slideshow/2018-compensation-overview-6009667?faf=1#2.
[15] American Dental Association (ADA). 2015. “Income, Gross Billings, and Expenses: Selected 2014 Results From the Survey of Dental Practice.” Chicago, Ill.: ADA. https://www.ada.org/~/media/ADA/Science%20and%20Research/HPI/Files/HPIData_SDPI_2014.ashx.
[16] CMS (2019), Table 7.
[17] The Commonwealth Fund. 2017. “International Profiles of Health Care Systems.” New York, NY: The Commonwealth Fund. https://www.commonwealthfund.org/publications/fund-reports/2017/may/international-profiles-health-care-systems.
[18] Remember, the lists of in-network doctors are constantly changing, so even if a person tries to make a careful choice based on the available information, they may find that their doctor(s) are no longer in-network after they select a plan.
[19] Chernew, Michael, et al. 2019. “Are Health Care Services Shoppable? Evidence from the Consumption of Lower-Limb MRI Scans.” Cambridge, MA: NBER. https://www.nber.org/papers/w24869.
[20] Tankersley, Jim. 2018. “A Winter-Coat Heavyweight Gives Trump’s Trade War the Cold Shoulder.” The New York Times, November 13. https://www.nytimes.com/2018/11/23/business/economy/columbia-sportswear-trump-trade-war.html.
[21] Katari, Ravi and Dean Baker. 2015. “Patent Monopolies and the Costs of Mismarketing Drugs.” Washington, DC: Center for Economic and Policy Research. https://cepr.net/publications/reports/patent-monopolies-and-the-costs-of-mismarketing-drugs].
This first appeared on the CEPR site.