Using pooled Household Pulse Survey data collected by the Census Bureau on a roughly bi-monthly basis starting on July 21, 2021 and ending May 9, 2022, CEPR found that childcare challenges were common among adults living with children, and higher among LGBT adults with non-LBGT adults.
About 1 in 4 LGBT adults (26%) lived with children under age 18, compared to just over one-third (36%) of non-LGBT adults. Among those living with children, LGBT adults were younger on average than non-LGBT adults, but had similar levels of education.
Just over 4 in 10 LGBT adults (41%) lived with a child under age 5 who was unable to attend childcare in the last four weeks before being surveyed, compared to 3 in 10 non-LGBT adults living with a young child.
Among adults living with 5-to-11 year olds, 28% of LGBT adults reported that a child in this age range was unable to attend childcare in the last four weeks before being surveyed, compared to 19% of non-LGBT adults.
Among both LGBT and non-LGBT adults with childcare challenges, the most common response was cutting hours of paid employment. For LGBT adults, the second most common response was taking unpaid leave; for non-LGBT adults, the second most common response was taking paid leave.
Among adults with childcare challenges, LGBT adults were more likely than non-LGBT adults to: take unpaid leave, lose their job, leave their job, and not look for a job.There were no significant differences in the percentages who cut hours, used paid leave, and supervised children while working.
Financial hardship is common among all adults experiencing childcare challenges, but higher among LGBT adults (62% reported moderate to severe financial hardships) than non-LGBT adults (51%). Food insecurity is less common, but still elevated among adults experiencing childcare challenges (25% of LGBT adults are food insecure compared to 17% of non-LGBT adults).
The federal government should help all families meet these challenges by passing legislation that would make childcare affordable for all parents and caregivers, and improve the quality of childcare and the compensation of childcare workers.
Before detailing these findings, this article provides some background on sexual orientation, gender identity, and sexual characteristics (SOGISC) questions in federal household surveys.
Background
Research and data from household surveys conducted by the federal government, like the Current Population Survey (CPS), provide crucial information about employment, income, health insurance, and other indicators of economic security. Policymakers, among others, rely on this information to make decisions every day. Unfortunately, lesbian, gay, bisexual, transgender, queer, intersexual, asexual, plus other non-straight, non-cisgender (LGBTQIA+) people are invisible in many of these surveys.
Surveys focused on health, like the National Health Insurance Survey (NHIS) and the Behavioral Risk Factor Surveillance System (BRFSS) survey, have added some SOGISC questions over the last decade. But key surveys focused on employment and living standards, like the CPS and the American Community Survey (ACS), have yet to add any SOGISC questions. Important legislation passed by the House on June 23, 2022, and supported by President Biden, would require federal statistical agencies to add voluntary SOGISC questions to these and other household surveys within three years.
At the same time, federal data isn’t completely lacking on LGBT living standards. Researchers have developed methods to identify same-sex couples in the CPS and ACS, and health-focused surveys like the BRFSS have been used to estimate LGBT poverty rates.
Moreover, the Federal Reserve has included questions about sexual orientation and gender identity in its Survey on Household Economic Decisionmaking (SHED) since 2019, and the Census Bureau added questions about sexual orientation and gender identity to its experimental Household Pulse Survey (HPS) in July 2021. In a previous article, CEPR used the SHED to document unpredictable work hours and unstable incomes among LGBTQ+ workers.
As discussed in the methodology section of this article, the sexual orientation and gender identity questions asked in the HPS do not include all people who identify as part of the broad LGBTQIA+ community, so our findings below are limited to LGBT adults and non-LGBT adults.
LBGT Adults Living with Children: Prevalence, Age, and Education
Within the HPS sample, 26 percent of LGBT adults reported having children under the age of 18 living in their household at the time of the survey, compared to 36 percent for non-LGBT respondents.
Of these caregivers, LGBT respondents are much younger than their non-LGBT counterparts: 32 percent of LGBT adults living with children are 18-29 years old, compared to 11 percent of their non-LGBT counterparts. This is consistent with other surveys finding that younger adults are much more likely to identify as LGBT than older ones.
Even with the skew to a younger demographic, LGBT and non-LGBT caregivers are similarly educated: 63 percent of LGBT caregivers have completed at least some college, as compared to 65 percent of non-LGBT caregivers.
LGBT Parents and Caregivers Are More Likely to Have Childcare Challenges
The HPS asks two questions related to childcare: (1) whether any children in the household were unable to attend day care or another childcare arrangement in the last four weeks as a result of childcare being closed, unavailable, unaffordable, or because the respondent was concerned about the child’s safety in care; and (2) for respondents who answered yes to the first question, how the respondent dealt with the childcare problem.
Figure 1 summarizes the responses to the first question by the adult respondent’s LGBT status and the age of the child. The time period (July 2021 through May 2022) is limited to the weeks the HPS asked about both LBGT status and childcare.
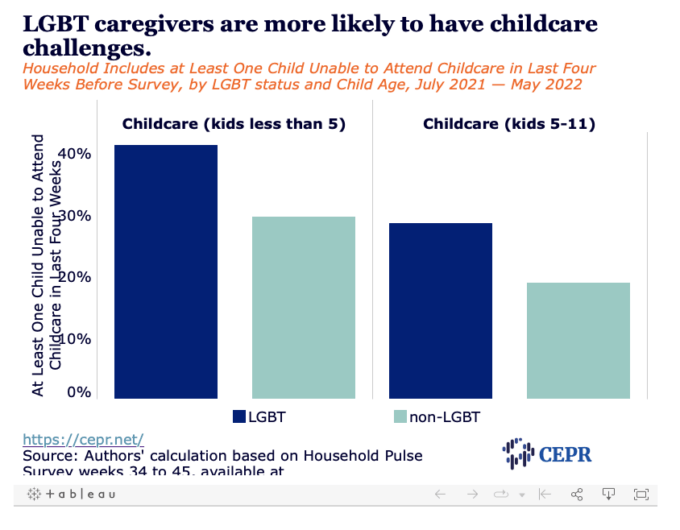
Of those with children under age 12, LGBT caregivers were 10 percentage points more likely to have had childcare problems. This difference is even larger for parents of young children. For caregivers of children under age 5, LGBT respondents were almost 12 percentage points more likely to report having childcare problems.
Figure 2 shows how respondents with childcare challenges responded to them. After experiencing childcare problems, LGBT parents were almost 9 percentage points more likely than non-LGBT parents to take unpaid leave from their jobs. They were also more likely to leave a job, lose a job, or not look for a job.

The disparities for respondents selecting “lost job”, “left job”, or “did not look for a job” are somewhat smaller than the disparities in “taking unpaid leave”, but they are all statistically significant. Note that all four of these responses entail lost earnings due to childcare challenges.
Financial Hardship and Food Insecurity
As Figure 3 shows, families with childcare challenges experience high rates of food insecurity and financial hardship. Here again, there are notable disparities between LGBT and non-LGBT adults. In households experiencing childcare problems, those with an LGBT parent or caregiver are 9 percentage points more likely to report not having enough food and 10 percentage points more likely to report moderate to severe financial hardship.

Policy Implications
In light of these findings and other research, there is little question that both LGBT parents and non-LGBT parents would benefit from childcare legislation currently pending in Congress. As CEPR previously documented in a joint report with The Century Foundation, establishing a universal childcare system would more than pay for itself by increasing parental employment and earnings, improving the quality of childcare jobs, reducing care-related business disruptions, and creating new jobs outside of the childcare sector.
The HPS is an experimental survey that relies on online respondents (rather than in-person or phone interviews) and has a relatively low response rate, so it would be helpful to have further research, using more established surveys, that examines the impact of childcare challenges on LGBT parents and caregivers. At the same time, it would not be surprising if future research finds similar disparities given historical and ongoing discrimination against LGBT parents.
As of 2021, five states had laws prohibiting surrogacy for same-sex parents and 11 states had laws permitting anti-LGBTQIA+ discrimination in adoption and foster placement. Recent developments also show legislation targeting LGBTQIA+ children and children of LGBTQIA+ families. The passing of the “don’t say gay” bill to limit the discussion of LGBTQIA+ identity in Florida public schools has sparked other states, like Alabama, Ohio, and Louisiana, to pen their own versions of the law.
Anti-LGBTQIA+ discrimination, coupled with economic struggles facing all US families, demands the attention of policymakers and activists alike. To accomplish this, SOGISC questions need to be added to all federally funded household surveys. This includes the CPS; ACS; the National Household Education Surveys (NHES); the Early Childhood Program Participation Survey (ECPP), which is the main household survey on early childhood education; and the Survey on Income and Program Participation (SIPP), an important longitudinal survey that includes questions about childcare.
Getting SOGISC questions added to these surveys will require research and testing to ensure that the questions are properly constructed, as well as continued public pressure from researchers and activists. All communities and identities deserve representation and visibility in research and public policy.
Methodology
Adult respondents are assigned to one of the following three categories according to the Census Bureau’s methodology:
+ “LGBT” includes individuals who: report sexual identity as gay, lesbian, or bisexual; identify as transgender; or report their current sex as something other than their sex at birth.
+ “Non-LGBT” includes individuals who report sexual identity as straight, and whose current sex aligns with their sex at birth.
+ “Other” includes respondents who select “none of these” for current gender identity and “something else/I don’t know” for the sexual orientation question; or respondents who select “something else/I don’t know” for the sexual orientation question, and whose current sex aligns with their sex at birth.
Results for the “Other” category are not reported in this article.
Additionally, consistent with the recommendations of the Center for American Progress, all observations in which the Census imputes the gender identity of a survey respondent are dropped. This is done to ensure the accurate identification of transgender individuals.
All measures are weighted using the provided person-level weights. The final sample, after dropping missing observations, consists of 46,129 LGBT and 563,951 non-LGBT individuals.
When restricting by age of children, the sample sizes are as follows:
+ Ages 0–4: 2,724 LGBT and 45,431 non-LGBT
+ Ages 5-11: 3,816 LGBT and 67,270 non-LGBT
+ Total under age 12: 5,442 LGBT and 92,677 non-LGBT
Table 1 provides the text of the HPS questions used in this article.

Source: Authors’ calculation based on Household Pulse Survey weeks 34 to 45.
This first appeared on CEPR.