The average global temperature is estimated to have been +5°C to +8°C higher than it is today, which current average can be taken to be 15°C (59°F). Thus, the average global temperature during the PETM was in the range of 20°C (68°F) to 23°C (73.4°F). [1]
A recent study published by the ETH (in Switzerland) has determined that:
“Accordingly, between 57 and 55 million years ago, the mean annual air temperature at the equator where Colombia lies today was around 41°C (105.8°F). In Arctic Siberia, the average summer temperature was 23°C (73.4°F).” [2]
The cause of this elevated global temperature was a large amount of carbon dioxide (CO2) and methane (CH4) in the atmosphere. How much of each, and how did they get there? There are numerous theories and no definitive answers. My sense of a general scientific consensus is that a large swarm of volcanic eruptions in the North Atlantic volatilized layers of methane hydrates (the cold pressurized crystalized precipitates of organic matter decayed by bacterial action) on the seafloor, as well as spewing CO2; and that wildfires and the burning of peat may have contributed to the carbon emissions.
The PNAS paper presents data supporting the idea that CH4 overwhelmingly dominated the greenhouse gas load, with CO2 concentration remaining steady at ~1000±500 ppm [1]; while the ETH report states that: “At that time, the atmosphere was essentially flooded by the greenhouse gas carbon dioxide, with concentration levels reaching 1,400ppm to 4,000ppm.” (ppm = parts per million) [2]
The amount of carbon lofted into the atmosphere, according to the PNAS paper, was in the range of 2,500GtC to 4,500GtC (GtC = giga metric tons of carbon = gigatonnes C); but it cites alternative scientific studies whose estimates range from 6,800GtC to 15,400GtC. [1] Their methods of analysis were unable to determine the timescale of the emissions pulse, but it must have been well less than the 200,000 year span of the PETM, to account for its recovery back to the “normal” conditions of the early Eocene Epoch.
Methane emitted into the atmosphere will eventually oxidize to CO2 and water by chemical reactions like the following:
CH4 + 2*O2 -> CO2 + 2*H2O
CH4 + 4*O -> CO2 + 2*H2O
CH4 + O3 -> CO2 + H2O + H2.
There are many more possible reactions because there are many intermediate species formed, such as: H (atomic hydrogen), OH (hydroxyl radical), HO2, CO (carbon monoxide), H2O2 (hydrogen peroxide). So it is likely that within a few millennia of a massive CH4 release that it has all been oxidized to CO2 and water vapor.
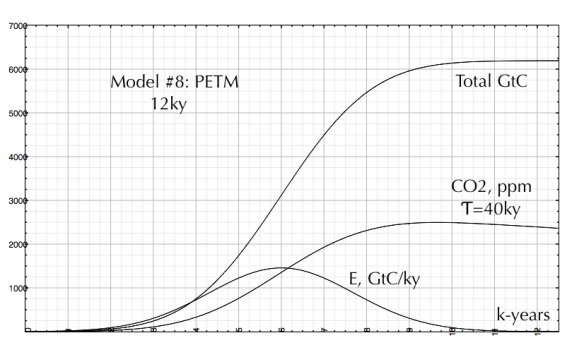
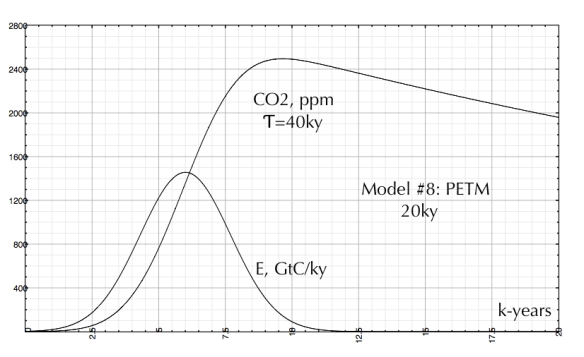
Thus, I thought it reasonable to model the PETM temperature history as due to an emissions pulse of CO2. Specifically, that pulse is a Gaussian with a full width at half maximum (FWHM) of 4,000 years (4ky); centered at 6ky from the start of the PETM, and with a peak emissions rate of 1,456GtC/ky (1,456 GtC per 1000 years, or 1.456GtC/y). By 12ky from the start of the PETM, that pulse has come and gone leaving 6,190GtC in the model PETM atmosphere.
The calculated CO2 concentration added rises to 2,500ppm between 9ky and 10.5ky from the start of the PETM, (presumably there was ~280ppm, or more, prior to the emissions pulse).
This model assumes that the composite relaxation time for CO2 absorption from the atmosphere is 40ky. The dominant process fixing atmospheric CO2 is taken to be the weathering of carbonate and silicate rocks and soils; and the processes of both photosynthesis and the absorption by the surface waters of the oceans — which act on much shorter time scales — are assumed to be saturated because of the high concentrations of CO2 in both the air and the oceans.
The course of this model PETM atmospheric carbon excursion out to 20ky is shown in Figure 3, and out to 100ky is shown in Figure 4.
Beyond 100,000ky, the model PETM CO2 concentration falls into the range of the pre-industrial levels of ~200ppm to ~300ppm.
The model atmosphere at 0ky was taken to have 0ppm of CO2, so everything shown in the Figures is only added carbon (added CO2). The added heating caused by the added CO2 is estimated at:
+∆T °C = [CO2ppm added]/[130ppm/1°C] – 11°C,
where a baseline has been assumed of an average global temperature of 11°C at “0ppm” (actually 170ppm to 270ppm) as existed in the depths of the Ice Ages of the Pleistocene Epoch (2.58mya to 11.7kya), when the global temperature hovered about -4°C±4°C from what it was in pre-industrial times (~15°C).
The ratio 130ppm/1°C comes from my estimate of a +130ppm rise in atmospheric CO2 (280ppm to 410ppm) during the 130 years between 1890 and 2020, accompanied by an average global temperature rise of 1°C.
The calculated history of the model PETM average global temperature rise — by the above method — peaks at +8.2°C, between 9.3ky and 10ky, and is shown in Figure 5. Thus, the peak average global temperature implied was 19.2°C (66.6°F).
If I assume that the model PETM temperature rise calculated above actually rested on a background global temperature of 15°C, similar to pre-industrial conditions (which might seem inconsistent, but there are many uncertainties), then the peak of the model PETM global temperature is 23.2°C (73.8°F).
Note that the ETH results were: +26°C at the Equator (41°C = 105.8°F) and +8°C in the Arctic during summer (23°C = 73.4°F), which are hotter for middle and tropical latitudes than in the model here.
My study here cannot rival the scientific rigor of [1] and [2] and it cannot quantify the entire complex of climate-affecting phenomena that occurred during the PETM; but it does give a clear general picture of a hyperthermal excursion caused by a massive pulse of carbon emissions into the atmosphere as occurred during the PETM.
The climate at that time was hotter and wetter, and with no polar ice; Antarctica was jungles, and the Arctic was a crocodile-infested swamp-ringed ocean.
Notes.
[1] Temperature and atmospheric CO2 concentration estimates through the PETM using triple oxygen isotope analysis of mammalian bioapatite
Alexander Gehler, Philip D. Gingerich, and Andreas Pack
PNAS July 12, 2016 113 (28) 7739-7744; first published June 27, 2016;
https://doi.org/10.1073/pnas.1518116113
[2] Back to the future of climate
Peter Rüegg
ETHzürich
26 October 2020
https://ethz.ch/en/news-and-events/eth-news/news/2020/10/back-to-the-future-of-climate.html


