Troubling and significant statistics produced by the government indicate important facts about our political system and its priorities. Unfortunately, these statistics often get little coverage in the media. What coverage is provided usually only focuses on the current year and might include comparison with the previous year.
Two such sets of government statistics cover wealth distribution and poverty. These statistics have a margin of error and do not account for the up and down fluctuations in the economy nor changing historical conditions or limitations of what any president can do.
What is perhaps most critical are the trends. These trends show that wealth has become more concentrated and more people are deemed by the government to be poor.
Wealth Inequality
Below are government figures that show the trend of growing wealth inequality.1
Share of Total Net Worth by Percentile of Wealth Owners, 1989-2013
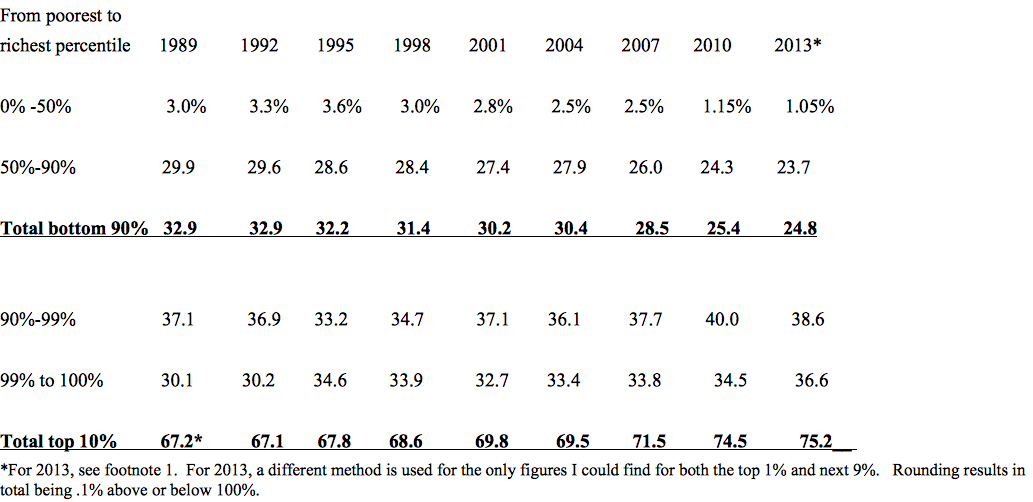
These figures show that during the presidencies of Bush Sr., Clinton, G. W. Bush, and Obama so far, a greater portion of the nation’s wealth has become more concentrated in the hands of the rich as indicated by the share of wealth held by the top 1%. From 1989 to 2010, it increased from 30.1% to 34.5% and, under another methodology, to 36.6% in 2013.
From 1989 to 2013, the share of the top 10% went from 67.2% to 75.2% or from slightly over 2/3 to more than 3/4 of the nations’ total wealth. This means that from 1989 to 2013, the drop in the share of wealth held by the bottom 90% went from 32.9%, almost a third, to 24.8%, less than one-fourth.
Even more striking is that from 1995 to 2013, the poorest half of the population, after experiencing its share of the nation’s wealth peaking in 1995 at 3.6%, underwent a more than 2/3 decline in their portion. It fell in 2013 to a paltry 1.05% of all wealth.
Despite the last few years of “recovery,” the share of wealth held by the bottom 50% of the U.S. population declined from 1.15% in 2010 to 1.05% in 2013. This is less than half of where it stood in 2007, before the great recession, when the share of the country’s wealth held by the poorest 50% of the population was at 2.5%.
In 2008, Obama spoke of hope for a better future. If the wealthy hoped for a greater share of the nation’s wealth, their hope was fulfilled while the wealth conditions of most everyone else have declined.
These changes in wealth holdings were clearly described by Federal Reserve Board head Janet Yellen who began a speech on October 17, 2014 noting:
“The distribution of income and wealth in the United States has been widening more or less steadily for several decades… This trend paused during the Great Recession because of larger wealth losses for those at the top of the distribution and because increased safety-net spending helped offset some income losses for those below the top. But widening inequality resumed in the recovery…” (emphasis added). 2
This widening inequality and greater concentration at the top was presumably more pronounced after 2013 when the value of the stock market rose with the Dow Jones Industrial Average reaching its peak at over $18,300 in May of 2015. Today, wealth inequality is probably back to where it was in 2013 since the stock market has recently gone down to 2013 levels.
Poverty
While wealth inequality has increased, the number of people living in poverty has also generally increased. Below are figures from 1981 to 2014 for the number of people deemed to be poor and their percentage of the population.3 This percentage has been 15% or higher for three years of Obama’s presidency, from 2010-2012. It had reached that level only three other times since 1981.
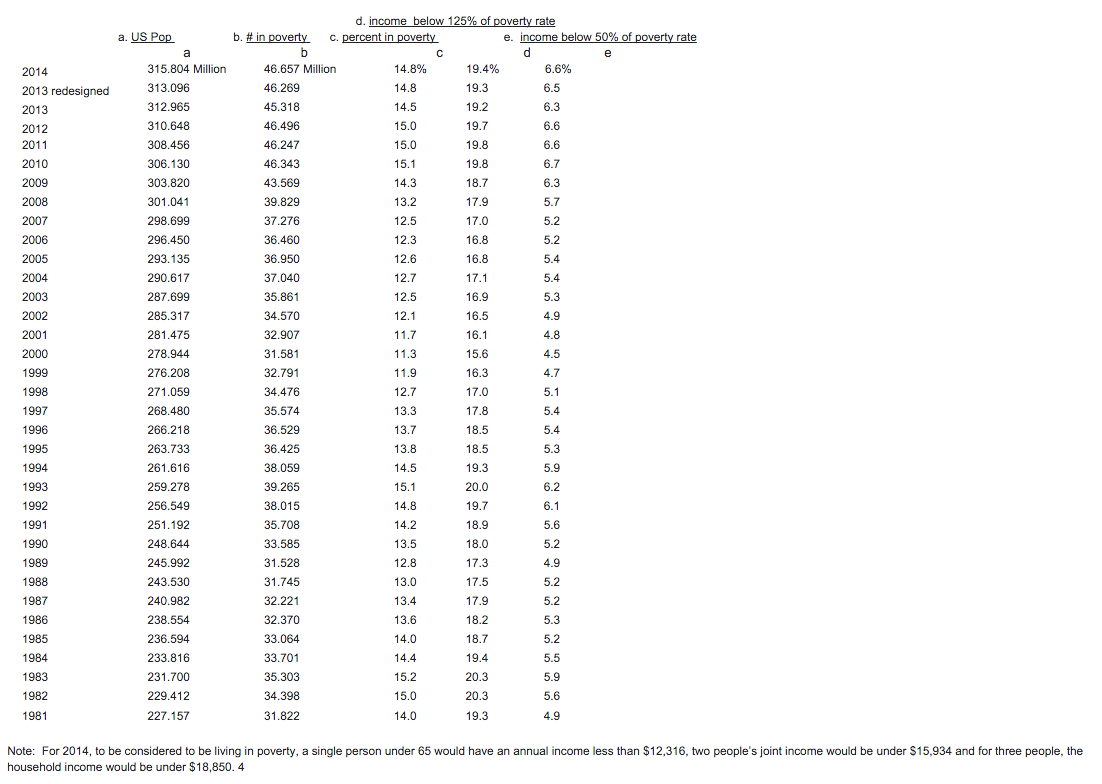
These numbers show that the rate of poverty since 1981 was lowest in 2000 at 11.3%. During the time George W. Bush was president, with exceptions, it steadily increased from 11.7% in 2001 to 13.2% in 2008. 5 As might be expected, the rate increased during the great recession peaking at 15.1% in 2010.
As of 2014, some six years after the beginning of the recession and during a period of “recovery,” the rate of poverty remains high at 14.8%. In fact, according to these government statistics, the rate of poverty for every year Obama has been president is higher than it was for every year during George W. Bush’s presidency.
The percent of people below 125% of the official poverty rate has also been higher every year under Obama than during Bush’s presidency, and has been over 19% every year from 2010 through 2014. The highest level it reached under Bush was during the start of the recession in 2008 when it was at 17.9%.
What is most disturbing is the percent of the population living in extreme poverty, or having an income at 50% or lower than the poverty level.5 Every year that Obama has been president, the percent of the population at that level of income has been over 6% and, as of 2014, consisted of over 20 million people. When George W. Bush was president, the percent was always under 6%. The last time it was over 6% was during the first year of the Clinton presidency. 6
Even the record during Reagan’s presidency may be viewed as more favorable than Obama’s. During the time Reagan was president, the official rate of poverty peaked at 15.2% in 1983. Thereafter, it gradually declined to 13.0% in 1988.7 By contrast, the rate of poverty during Obama’s time in office has always been more than 14.3% and was 14.8% in 2014, or almost 2% higher than it was at the end of Reagan’s presidency.
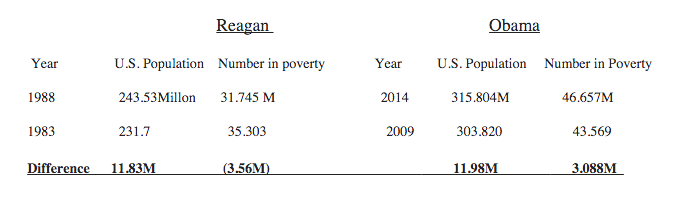
A quip that was made about Reagan is that he liked poor people so much that he acted to increase their numbers. During his first three years, the poverty rate and the number of people deemed to be impoverished increased, reaching its peak in 1983. Thereafter, from 1983 to the end of Reagan’s presidency in 1988, the number of people deemed to be poor declined by over 3.5 million ending at slightly below the total during the first year of his presidency.
In contrast to the record of Reagan’s presidency, during the time Obama has been president and statistics are available, 2009-2014, the population has grown by 11.98 million. This is close to its growth for the last six years of Reagan’s presidency. Yet, the number of people deemed to be living in poverty has not declined, but has increased by more than 3 million. For comparison, see this table extrapolated from previous figures:
If, in 2008, one hoped for the presence of more poor people and for a greater concentration of wealth in the hands of the rich, so far, during Obama’s presidency, these hopes have been fulfilled. They will presumably continue were a Republican elected president. Should one also expect more of the same from Hillary Clinton who wants to build “on the progress the president has made,” or Bernie Sanders who thinks Obama “has done an excellent job?”8
Footnotes
1. Wealth is the value of what one possesses minus what is owed. Unlike income, it is not subject to a yearly tax. It is also distributed more unequally than income. See the last tables in the links at the end of this footnote.
see page 4 in An Analysis of the Distribution of Wealth Across Households at https://www.fas.org/sgp/crs/misc/RL33433.pdf and
For 2013, a figure for the top 1% is not provided. See the next two sites.
https://www.federalreserve.gov/pubs/bulletin/2014/articles/scf/accessible.htm#box3figA
another table with historical trends: see Figure 3 at: It is source for bottom 50% figure of 1.15% in 2010 and 1.05% in 2013. https://www.federalreserve.gov/newsevents/speech/95BF8144CFB24C649FAEF51B056738B9.htm
The source for the 2013 figures for the top 1% and the 90-98.9% whose figures from 1989-2010 are slightly different are in Table A1C on page 34 at: https://www.federalreserve.gov/econresdata/feds/2015/files/2015058pap.pdf
According to one study, as of 2012, the top .01% of the population or about 16,070 families whose average wealth is about $371 million, possess 11.2% of all wealth and the top .1% possess about 22% of all of the country’s wealth. See table 1 at the end of the paper after references at: https://gabriel-zucman.eu/files/SaezZucman2016QJE.pdf
Figure 1 in the same location shows the share of wealth holdings of the top .1% from 1913-2012. It was below 10% in 1989 which means it more than doubled during the subsequent years.
For income inequality see https://www.census.gov/library/publications/2015/demo/p60-252.html tables:
Income Distribution Measures Using Money Income and Equivalence Adjusted Income: 2013 and 2014 [PDF – 46k] and
Selected Measures of Household Income Dispersion: 1967 to 2014 [PDF – 402k]
2. https://www.federalreserve.gov/newsevents/speech/yellen20141017a.htm
3. https://www.census.gov/library/publications/2015/demo/p60-252.html see table under Poverty title
Impact on Poverty of Alternative Resource Measure by Age: 1981 to 2014
Those with income at 125% of poverty rate see https://www.census.gov/hhes/www/poverty/data/historical/people.html
Table 6. People Below 125 Percent of Poverty Level and the Near Poor
Those with income at 50% of poverty rate see
Table 22. Number of People Below 50 Percent of Poverty Level
Noteworthy about poverty in the U.S. is that in 2014, 21.1% or 15.5 million children under 18 years of age were deemed impoverished by the government, and some 6.8 million of them lived at one-half the official poverty rate. The rate of poverty among Blacks (26.2%) and those who are “Hispanic any race” (23.6%) is much higher than that of the general population. See https://www.census.gov/library/publications/2015/demo/p60-252.html see tables under Poverty title
People and Families in Poverty by Selected Characteristics: 2013 and 2014 and People With Income Below Specified Ratios of Their Poverty Thresholds by Selected Characteristics
4. see https://www.census.gov/hhes/www/poverty/data/historical/people.html
Table 1. Weighted Average Poverty Thresholds for Families of Specified Sizes
5. During the Clinton administration, the rate of poverty and the number of people deemed to be poor remained high as both steadily declined.
During the Clinton years and continuing thereafter, wealth became more concentrated at the top in part due to the dot-com boom and from policies enacted including NAFTA, the repeal of
Glass Steagell and reduced taxes on some forms of investment income.
6. A single person with a level of income at 50% of the poverty threshold lives on less than $17/day. A couple would be having to get by on less than $22/day.
7. The rate and number of people living in poverty increased during all four years of the presidency of Bush Sr.
8. Clinton quote: see https://www.msnbc.com/rachel-maddow-show/hillary-clinton-i-want-build-obama-era-progress
Sanders quote at: https://www.nytimes.com/2016/02/05/us/politics/democratic-debate.html?hp&action=click&pgtype=Homepage&clickSource=story-heading&module=first-column-region®ion=top-news&WT.nav=top-news