Last month I wrote a piece where I managed to mangle a very simple point. While the reported saving rate had fallen in April, it was actually due to people paying more capital gains taxes, not the result of households spending down savings.
The issue here is straightforward. Saving is defined as the portion of disposable income that is not consumed. Savings can fall either because either consumption has increased, or disposable income has fallen.
We are not seeing especially rapid consumption growth in 2022 (real consumption actually fell in May), rather we are seeing weak growth in disposable income, which is defined as personal income, minus tax payments. The story here is not that personal income growth has been weak, but rather that tax payments have soared.
The May data show taxes being paid at an annual rate of $3,123.4 billion (NIPA Table 2.1, Line 26). This is up by 41.6 percent, from the $2,205.1 billion paid in taxes in 2019.
This big jump in tax payments cannot be explained by an increase in tax rates. There have been no major increases in taxes since 2019. Rather, the jump in taxes almost certainly reflects large capital gains tax payments that people are making on stock they have sold in the last year. The huge runup in the stock market means that many people would have substantial amounts of taxable gains.
Capital gains are not counted as income. This means, for example, if a person reported $100,000 in capital gains from selling stock, and then paid $20,000 in capital gains taxes (for high income people, the capital gains tax rate is 20 percent), we would report their savings as being down by $20,000.
To most people, this would not be a story of someone spending down their savings. After all, even when they have paid their taxes, they can bank $80,000. But in the National Income Accounts, this would appear as a drop in savings.
If we want to see what saving looks like excluding the change in tax payments, we can simply combine tax payments and reported savings, and that as a percentage of personal income. (This only is a useful calculation when there have been no major changes in the tax code.) Here is the picture for 2018 and 2019, and the first five months of 2022. (I’m leaving out 2020 and 2021 because the data are skewed by large pandemic-related transfer payments.)
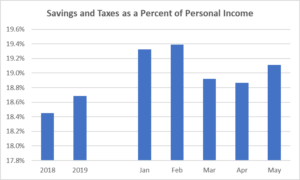
Source: Bureau of Economic Analysis and author’s calculations.
It is hard to tell a story of people dipping into their savings here. The combined rate of tax payments and savings is actually somewhat higher in the first five months of 2022 than in 2018 or 2019. To be clear, these are aggregate data. There are millions of families who are undoubtedly spending down their savings and going into debt.
These calculations simply refer to the aggregate data published monthly by the Commerce Department, which had been the basis for many articles claiming people were spending down their savings. That data actually show that people are paying capital gains tax on the money they made in the stock market, not spending down savings.