
One of the more impressive accomplishments of the United States in recent decades is how it has achieved greater economic inequality in line with what Marx expected from a capitalist economy. There are periods of setbacks—in which economic inequality is reduced–followed by improvements resulting in even higher levels of inequality.
Advancing economic inequality has been a bipartisan undertaking. The actions of both the Democrats and Republicans in power have increased economic inequality as their leaders, together, champion the interests of the rich and powerful at the expense of the middle and working classes. Additionally, despite the growth in the diversity of the ruling class, economic inequality has continued to widen.
Examples of progress towards greater economic inequality that results in unmet needs and misery for many is made apparent in media stories such as a recent one in the Guardian with the title “I can’t afford groceries’: why one-third of US college students don’t have enough to eat.”
Wealth Inequality
Wealth is the value of what one owns minus one’s debts. Many people owe more than all of what they own is worth. They have negative wealth. Then there are those at the top who have played a major role in our country’s success at achieving such high levels of economic inequality. They include our “generous” good friends, the “job creators,” Musk, Bezos and Gates, the wealth of each is more than $100 billion.
The Federal Reserve Board, the banker’s bank, has been providing data on the distribution of wealth in the U.S. going back to 1989. The share of the nation’s wealth held by the wealthiest has grown tremendously. In 1989, the wealthiest one-tenth of one percent held 8.7% of the nation’s wealth rising to 12.6% as of the end of 2022.
The Fed’s data show that in 1989, the wealth of the .1% was 2.26 times greater than the poorest 50%. At the end of 2022, the value of their holdings, $17.6 trillion, was more than four times greater than the wealth, $4.16 trillion, of the poorest 50% of the U.S. population.
The table below, using the Fed figures from 1989 to 2022, shows the growth in wealth inequality. Highlighted are the highest percent of the holding of the entire nation’s wealth by the wealthiest 1% reached during the terms of presidents in a particular quarter going back to Bush, and the first quarter of the survey.
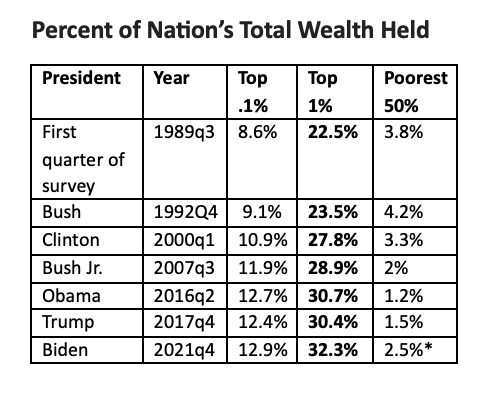
*The increase is largely due to the increase in value of the homes for those who own them.[1]
During each administration since 1989, the share of the nation’s wealth held by the wealthiest 1% has had its declines, but the trajectory has been up. It reached a new record during the presidencies of everyone except Trump, who came close and whose tax cut bill helped pave the way for a new record.
To restore the share of the wealth of the wealthiest 1% back to where it stood in 1989 would require the immediate confiscation of over $12 trillion of their $43.45 trillion as of the end of 2022.
Senator Elizabeth Warren, probably considered one of the more “progressive” members of the Senate, has put forward a wealth tax proposal that would raise “$3.75 trillion in revenue over a ten-year period.” In the last ten years, the nominal wealth of the 1% increased over $23 trillion from $19.81 trillion to $43.45 trillion, more than six times the anticipated revenue raised by Warren’s tax proposal which, at best, would likely make a tiny dent into what she describes as “an extreme concentration of wealth.”
Wealth Inequality and Race
There is great inequality in wealth among racial and ethnic groups. The Federal Reserve Board figures show changes in wealth holdings for whites, Blacks, Hispanics, and what they label as “Other.”

The percent of total wealth held by whites declined from 90.4% to 82.4% while the share held by Blacks and Hispanics increased from 6.1% to 7.7% which may partly reflect the decline in the relative size of the white population. However, more significantly, the gap in the holdings of whites compared to Blacks and Hispanics together increased more than six times going from $17.23 trillion to $104.57 trillion.
Increase in Wealth of the 1% and the National Debt
Many believe that the recent “compromises” reached over the extension of the national debt are likely to bolster economic inequality. According to the Center on Budget and Policy Priorities, the “Debt Ceiling Agreement’s SNAP Changes Would Increase Hunger and Poverty for Many Older Low-Income People”
From 1990 to 2020, as the size of the national debt has increased, so has the growth in the wealth of the 1% at close to the same rate. (see table below) That suggests the possibility that there is a close relationship in the growth of both. Is the growth in the wealth of the 1% relative to the national debt the real crisis instead of the size of the national debt relative to the size of the gross national product to which the debt is often compared?

Income Inequality
Income is the amount of money one makes in a given period of time– usually a calendar year. For most people, the primary source of their income is from working or in the form of a pension/social security resulting from work previously done. By contrast, most of those who are wealthy gain the bulk of their income not from work, but from their investments that provide them with forms of income that include rent, interest, dividends, and capital gains.
Every year, the U.S. Census Bureau does an estimate of the country’s income and how it is distributed. The latest figures go through 2021. What their estimate shows is that the gap in the income of those with the most to those making the least has widened.
The table below uses Census Bureau figures.[2] It shows average household income of the top 5% and lowest 60% of the population using 2021 dollars adjusted for inflation that highlights the highest level for the top 5% in each administration.

From 1979 to 2021, the difference in the size of the average income of the 5% compared to the lowest 60% greatly widened going from $194,967 to $437,982.
Additionally, the share of the nation’s total income going to the top 5% increased from 16.9% in 1979 to 23.5% in 2021, it highest point. By contrast, during this same period, the share of income going to the poorest 20% declined from 4.1% to 2.9%. The share of the entire bottom 60% went from 31.1% in 1979 to 24.8% in 2021, its lowest point in the 54 years of the survey.
The Minimum Wage
Could anyone have imagined that when the national minimum wage was raised to $7.25/hour when Junior Bush was president that it would remain at that level during the presidencies of Obama, Trump and, so far, the Biden administration? That is an impressive record for promoting economic inequality. It has been undercut by some cities and states. For examples, the minimum wage in California now stands at $15.50 per hour, and in San Francisco, it will soon reach $18.07. However, compared to much of the rest of the country, California has extremely high costs for housing and other essential items. Despite its higher minimum wage, California, a state that has been politically dominated by members of the Democratic Party for years, is “home” to the largest homeless population. From an article in CalMatters,
“California accounted for 30% of the country’s homeless population in 2022, despite making up less than 12% of the total population, according to federal data released Monday. It was also home to 50% of the country’s unsheltered people, or those living in places such as streets, cars or parks.”
Furthermore, according to the “nonpartisan” Public Policy Institute of California,
“California has topped the list for the state with the largest homeless population for more than a decade…. including half of all unsheltered people (115,491 in California; 233,832 in the US).”
People may be paid better in California, but more people appear to fall through the cracks.
Why Growing Economic Inequality
There are many factors that contribute to greater economic inequality. They include the normal operations of a capitalist economy, and the enormous power currently exercised by the ruling class which either holds key positions in the government or they are held by those who champion their interests. That has resulted in government spending and tax policies that are highly favorable towards the rich. The latter include the lowering of corporate tax rates; the lowering of the tax rate on long term capital gains and on most dividends; the lack of a wealth tax in which much wealth in the form of, for example, stock holdings is never taxed; a weak estate tax system that now leaves estates untaxed that are worth less than $12 million for a single person and $24 million for a couple; and tax free interest earned on municipal bonds. All of which have helped to pave the way for creating a system that allows for the legal expansion of economic inequality.
There may be much truth in the quote attributed to Honore de Balzac that “Behind every great fortune lies a great crime.” Certainly, such a phenomenon continues. Additionally, as pointed out in a recent article in the New York Times, “legally approved forms of tax avoidance are the major tool of wealth preservation.” This suggests that our legal system is arranged to legitimize and protect the results of what could be great crimes. Afterall, slavery was accepted by the Founders who included it as a legitimate institution in their venerated document, the original seven articles of the Constitution. Today, the exploitation of workers to the point where many are paid poverty level wages is generally treated as perfectly legal.
Perhaps, most importantly, what currently accounts for growing inequality has been the weakening of the working class. For example, far fewer workers belong to unions and, too often, the unions to which they belong are led by people who are undemocratic, overly bureaucratic, paid at a much higher level compared to those they “represent,” and overly inclined to cooperate with management. And many union leaders accept divisive and unfair two-tier contracts that weaken workers. Two-tier contracts are especially huge problem in higher education where part-time or contingent faculty, with no job security, who are equally qualified and as experienced as a tenured full-time faculty member can teach the same class and receive significantly less pay and inferior benefits.[3]
The Future
A continuation of growth in economic inequality is likely. Afterall, Biden is reported to have made a campaign promise to wealthy donors that “nothing would fundamentally change” if he is elected.[4] Furthermore, reported in a May 23 New York Times article was that despite “the strong job market,” a survey done by the Federal Reserve found there was a “drop in overall well-being in 2022” with 51% of Americans spending more than they made each month, and with 37 percent saying they did not have cash available to cover a $400 emergency expense, up from 32% in 2021.
Growing inequality can be reversed if people, especially workers, get better organized and struggle against capitalism, the ruling class and its sycophantic enablers who increasingly benefit from the continuation of maintaining and increasing economic inequality and misery for much of the population.
Notes.
[1] See my article where I show how the bulk of the increase in the wealth of the poorest 50% is due to the increase in the value of the housing of those who own a house that fills a basic need.
Often, when the Fed has provided an update, the numbers can be slightly changed.
[2] Highest Average income amount for the top 5% usually occurs during the last year of one’s presidency with the exceptions being years of economic downturns. The first year of Biden’s presidency is the only year provided. All figures come from table A-4b on pg. 31.
[3] Local higher education teacher unions have acted to perpetuate two-tier contracts. For negotiations around my expired contract, my local union leaders put forward proposed contract changes calling for “a one-tiered contract with equality in pay, benefits, and strengthened job security for all faculty and all assignment types,….” However, they followed up with their specific negotiating proposal that, if enacted, would not reduce inequality, but increase it when comparing the pay per class taught by part-time faculty with a class taught by full-time faculty. Their proposal would also increase the gap in pay between lower and higher paid full-time faculty. The specific proposal is for pay percentage increases which result in those who are the highest paid receiving the biggest pay increase. For example, those making $100,000 receiving 6% more would see their salary increase by $6,000 while a faculty member, presumably with much greater difficulties meeting their basic needs who makes $30,000 a year, would be getting only an additional $1,800, widening the gap in their total pay (not including a likely widening gap in benefits) from $70,000 to $74,200, and in the pay per class taught.
My AFT 2121 leaders are making proposals that would increase inequality even though California Federation of President Jeff Freitas envisions a future that brings an “end to the two-tier system” that involves “equal pay and benefits for equal work.”
[4] Reported in Vox was that “Biden repeated his earlier remarks that he didn’t want to “demonize” the wealthy, and added that though “income inequality” is a problem that must be addressed, under his presidency, “no one’s standard of living will change, nothing will fundamentally change.” He went on: “I need you [wealthy donors] very badly. I hope if I win this nomination, I won’t let you down.””
