
A new category has been added to the latest Federal Reserve Board figures on the distribution of household wealth—the wealth of the wealthiest one-tenth of 1 percent going back to 1989.
In 2019, to gain entry into the wealthiest .1% of residents of the United States required one to be worth over $43 million which was about three and a half times the entry point of $11.1 million for the wealthiest 1%.1
There is a huge difference between those at the top of the .1%–people such as Musk, Bezos, and Gates–and those at the entry level. One worth $43 million could not even afford to pay for two years, at $25 million a year, the annual cost to run Bezos’ $500 million yacht.
As of September 30, Musk was the wealthiest of the trio. His net worth was put at $238 billion by the Bloomberg Billionaires Index. That is a sum that is more than 2,300 times greater than that of a poorer member of the .1% who is worth a mere $100 million.
Growing Concentration of Wealth at the Very Top
Below is a table derived from the Federal Reserve figures showing what has happened to the size of the wealth of the .1% since the presidency of daddy Bush.
Three categories below
1. Size of the wealth of the wealthiest .1% in trillions.
2. Wealthiest .1% share of the nation’s total wealth
3. Wealthiest .1% share of the wealth of. the wealthiest 1%

The development of capitalism is uneven. In addition, capitalism is an unstable system that has periods of rapid growth followed by periods of slow or negative growth. One should not be surprised that the further consolidation of wealth has temporary setbacks such as happened during the great recession before it rose to new heights.2
As can be seen from the above table, despite setbacks during economic downturns, the share of the nation’s wealth held by the wealthiest .1% has increased from a low in the third quarter of 1989 of 8.6% to its highest level in the fourth quarter of 2021 of 13%, a more than 50% increase. During the same time, the share of the wealth of the .1% as a share of the wealth of the 1% also increased.
Below is a table showing the wealth of the wealthiest .1% and poorest 50% when Daddy Bush was in power, and that of the two groups in the fourth quarter of 2021, its highest point. By the fourth quarter of 2021, the wealth holdings of the .1% had gone from being 2.3 times as much as that of the poorest 50% to almost 5 times more. The differences between the two groups would be even greater had a recent upsurge in the wealth of the poorest 50% not occurred due to increasing real estate values that, for most owners among the 50%, fill a basic need for shelter.3
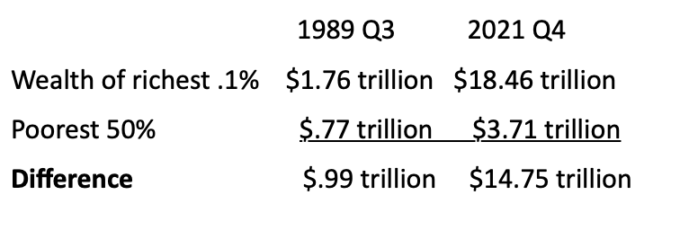
What is clear from both sets of the above figures is that the wealthiest .1% have been the recipients of major transfers of wealth during both Democratic and Republican presidencies. The increase in the nominal dollar value (which is the dollar amount disregarding the impact inflation has on its purchasing power) during this period went from $1.76 trillion in 1989 to $18.46 trillion, a more than 10-fold (1,048%) gain which was a rate of growth more rapid than the rate of inflation during the period. It was far greater than the growth rate for the poorest 50% and poorest 90%. The wealth of the poorest 50% increased in nominal dollars 482% from $.77 trillion to $3.71 trillion and the poorest 90% wealth increased 530% in nominal dollars from $8.19 trillion to $43.45 trillion. The result is a more extreme concentration of wealth at the top with the growth of a much greater gap between the .1% and everyone else, even for those within the wealthiest 1%.
Recent Decline in the Holdings of the .1%
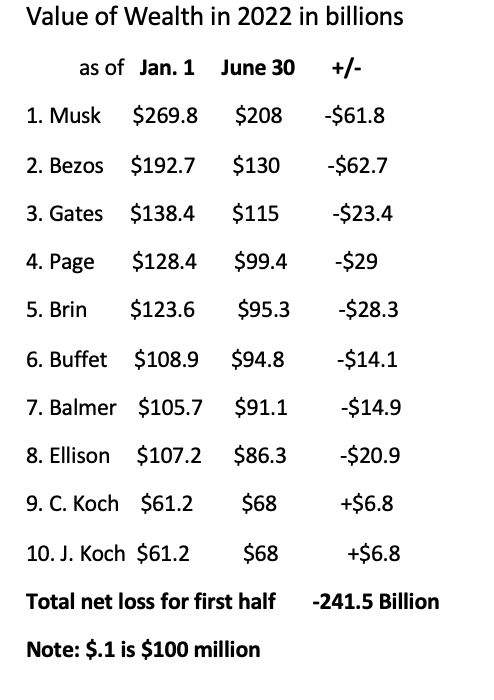
According to the latest Federal Reserve Board figures, from the end of 2021 to the first half of 2022, the nominal wealth of the .1% has declined by $1.41 trillion. Factoring in inflation, the decline is even greater.4 Much of this decline presumably has to do with the falling stock prices. Interestingly, a disproportionately larger share of the decline has been, perhaps “unfairly,” absorbed by our 10 wealthiest Americans. Their wealth accounted for 7% of the total wealth of the .1% at the beginning of the year. Yet, the decline in their wealth during the first 6 months in 2022 accounted for 17.1% of the total loss of the .1%. According to the Bloomberg Billionaires Index, here is what has happened to the wealth of these fine individuals during this period.
If one adds in the decline in wealth experienced by our now poorer good friend, Mark Zuckerberg, who, in the first half of the year, saw his wealth decline by an impressive $65.5billion, the net total loss (factoring in the gains of the Kochs) for those individuals comes to $307 billion. That accounts for over one-fifth, 21.8%, of the total decline in the wealth of the entire .1% for the first half of the year.
From 2020 thru 2021, the wealthiest ten, using the Bloomberg figures, gained some $583.9 billion.5 Throw in Zuckerberg and it comes to over $630 billion making them way ahead of where their wealth was before the outbreak of the pandemic—by more than $323 billion—which, if the stock market crashes, could be wiped out. To be fair, $180 billion of their $323 billion gain since 2020 through the first half of 2022 has ended up in the pocket of just one individual, the ever-delightful Elon Musk.
Zuckerberg has managed to achieve a loss of $65.5 billion in just the first half of 2022. Nevertheless, he remains extremely wealthy after this loss with his wealth still put at $60 billion. Only a sick society would allow one to accumulate this much wealth and remain extremely wealthy after losing $65.5 billion.6 The sickness is even more apparent when taking into consideration the large number of people in the United States who live with food insecurity and homelessness.7
Notes.
[1] https://dqydj.com/top-one-percent-united-states/ for the cut-off point for the .1%.
A table cited in the New York Times indicates that membership into the 1% can vary with one’s age. https://www.nytimes.com/interactive/2019/08/12/upshot/are-you-rich-where-does-your-net-worth-rank-wealth.html scroll down and then “click here to skip the exercise.”
2 The concentration of wealth does not have to increase. It could be reversed by a shift in power that stops further concentration from happening.
3 According to Fed figures, in the first quarter of 2016, the wealth of the wealthiest .1% was $10.81 trillion, more than ten times as great as the wealth of the poorest 50% whose wealth then was put at $1 trillion.
Recently, the wealth of the poorest 50% has shot up reaching $2 trillion for the first time in the second quarter of 2020 and $4.41 trillion in the second quarter of 2022. This is largely a result of the increasing value of the homes some own. During this time, the value of their real estate minus their home mortgages went from $1.21 trillion to $3.17 trillion, accounting for more than 81% of the increase in their wealth.
4 The impact of inflation on the super wealthy may not be quite the same as what is experienced by most everyone else. For example, the cost of super yachts may be declining due to the greater supply coming to the market resulting from the seizure of such vessels owned by Russian oligarchs.
5 see my article at https://www.counterpunch.org/2022/07/08/the-wealth-of-the-wealthiest-1-and-poorest-50-since-biden-became-president/ The gain of $583.9 billion of the ten wealthiest during that period was 11.4% of the gain of the entire wealthiest .1%
6 As of September 30, according to the Bloomberg Billionaires Index, Zuckerberg had lost even more for the year, $74.6 billion, leaving the size of his wealth at $50.9 billion.
7 Below are government studies on the degree of poverty, hunger and homelessness adversely affecting millions of people. https://www.census.gov/content/dam/Census/library/publications/2022/demo/p60-277.pdf pg. 21 In 2021 some 37 million people are living in poverty of whom over 11 million are children.
https://www.ers.usda.gov/webdocs/publications/104656/err-309.pdf?v=4127.5 Page IV “In 2021, 89.8 percent of U.S. households were food secure. The remaining 10.2 percent (13.5 million households) were food insecure. Food-insecure households (those with low and very low food security) had difficulty at some time during the year providing enough food for all their members because of a lack of resources…. Children were food insecure at times during 2021 in 6.2 percent of U.S. households with children (2.3 million households), down from 7.6 percent in 2020 and not significantly different from the 6.5 percent in 2019. These households with food insecurity among children were unable at times to provide adequate, nutritious food for their children.”
Homelessness https://www.huduser.gov/portal/sites/default/files/pdf/2021-AHAR-Part-1.pdf In January of 2021, due to the pandemic, only the sheltered homeless were counted. The sheltered homeless “refers to people who are staying in emergency shelters, transitional housing programs, or safe havens.”
From page ii “On a single night in 2021, more than 326,000 people were experiencing sheltered homelessness in the United States.”
The prior year study accounts for all homeless people. From https://www.huduser.gov/portal/sites/default/files/pdf/2020-AHAR-Part-1.pdf page 1
“On a single night in 2020, roughly 580,000 people were experiencing homelessness in the United States. Six in ten (61%) were staying in sheltered locations—emergency shelters or transitional housing programs—and nearly four in ten (39%) were in unsheltered locations such as on the street, in abandoned buildings, or in other places not suitable for human habitation.”
