
Introduction
Budget projections show the federal budget deficit growing substantially in the next decade and beyond. A major part of this story is high US health care costs. The United States pays roughly twice as much per person for its health care with little to show in the way of better outcomes. If US health care costs were in line with those in other countries, the budget picture would be substantially improved.
I will make five main points in this discussion. First, I show how the budget outlook would look if US health care costs were comparable to those in other wealthy countries. Second, I point out that US health care costs have actually slowed substantially over the last decade. This fact has drawn remarkably little attention. Third, I point out that we pay roughly twice as much for prescription drugs as other wealthy countries and describe routes for bringing down drug prices. Fourth, we also pay twice as much for our physicians as other wealthy countries. Fifth, our administrative costs also vastly exceed costs in other wealthy countries.
These areas are sources of massive waste. If we could get these costs more in line with costs in other wealthy countries, universal health care coverage in the United States would be affordable and not be a major drain on the budget in the years ahead.
US Health Care Costs and the Budget Deficit
Figure 1 shows the Congressional Budget Office’s (CBO) projection for the budget deficit as a share of GDP over the next three decades. It also shows what the deficit would look like if we paid the same amount per person for our health care as in Germany.[1] While per person health care costs in Germany are just 56 percent of those in the United States, it is actually a relatively high-cost country among the OECD. Per person costs in France are less than 49 percent of those in the United States. In Japan, they are less than 47 percent while in the United Kingdom they are just over 42 percent.[2]
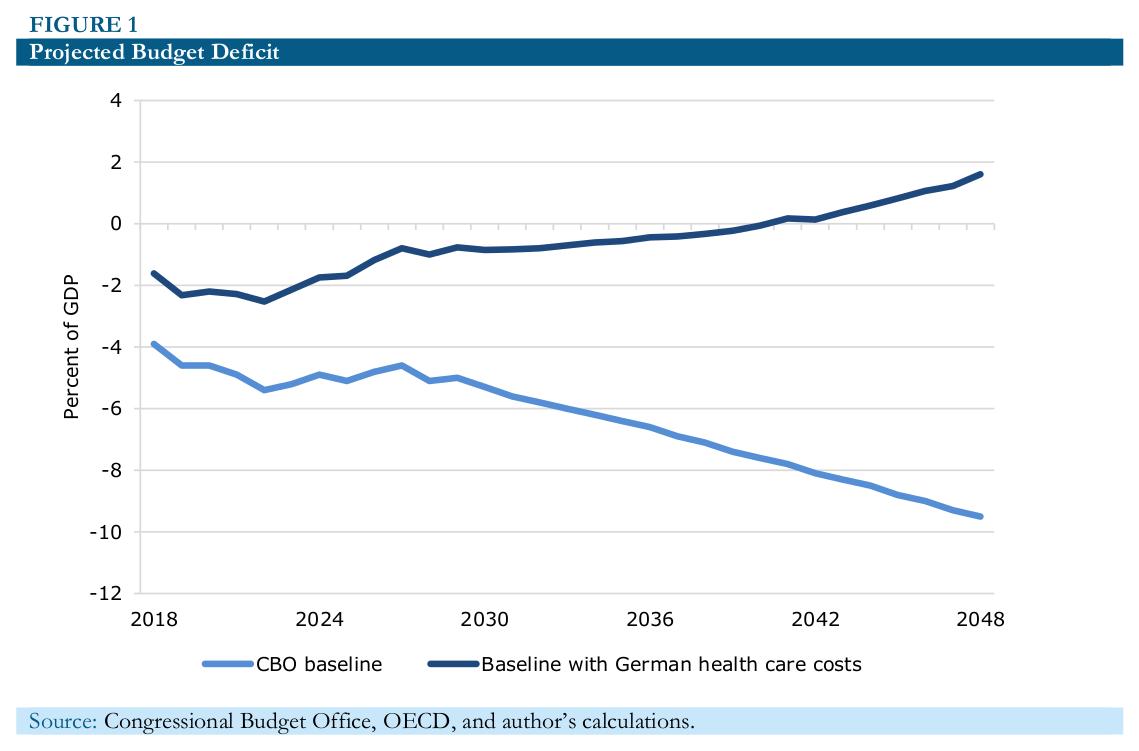
As can be seen, the projected course for the budget deficit looks hugely different in the scenario in which US health care costs are the same as in Germany. The baseline projection shows a sharply rising deficit. This is both due to projected increases in government spending on health care over the next three decades and a sharp rise in projected interest payments as the debt-to-GDP ratio is projected to increase rapidly over this period.
The baseline projections show total government spending on health care rising from 5.2 percent of GDP in 2018 to 9.2 percent of GDP in 2048. The biggest factor in this projected increase is the aging of the population, with both a large percentage of the population eligible for Medicare and also the average age of Medicare beneficiaries rising substantially. Net interest on the debt is also projected to increase, going from 1.6 percent of GDP in 2018 to 6.3 percent in 2048, as the ratio of public debt to GDP rises from 78 percent to 152 percent.
The story is quite different in the scenario where we pay the same per person health care costs as in Germany. Instead of rising over this period, the deficit is projected to fall and actually turn into a surplus in 2041. The two big factors here are that the savings from paying lower per person health care costs are much larger as projected health care costs in the United States rise relative to GDP. In 2018, the savings from paying German levels of health care costs would be 2.3 percent of GDP, by 2048 they would be more than 4.0 percent of GDP.
While the baseline projections show the debt-to-GDP ratio rising ever higher, the projections assuming German health care costs show the debt to GDP ratio falling throughout the period. In fact, the debt is projected to be paid off completely in 2044 and the US government begins accumulating assets. This means that instead of paying net interest of 6.3 percent of GDP in 2048, in the scenario with German health care costs the government would be collecting interest on its assets equal to 0.7 percent of GDP.
Of course, both the projections in the baseline and my alternative scenarios are highly unrealistic. Our ability to project health care costs has been very poor, as I’ll show in a moment. Also, these projections are drawn assuming that current tax and spending policy remains in place for the next three decades. One thing of which we can be quite certain is that tax and spending policy in 2048 will look very different than it does today.
The History of Health Care Spending Projections
Our ability to project the course of health care spending has been notoriously bad. The problem is that we project the past into the future, and that turns out not to be a very good predictor of health care costs. In 1991, analysts at the Health Care Financing Administration (the predecessor to the Centers for Medicare and Medicaid Services [CMS]) projected that health care spending would rise to 26.1 percent of GDP by 2030.[3] By 2020, costs were supposed to reach 22.7 percent of GDP. Spending was equal to 18.0 percent of GDP for 2017, the most recent year for which full data are available and is now projected to rise to 18.4 percent for 2020.[4]
The difference between the projection for 2020 from 1991 and the most recent projection is 4.3 percentage points of GDP. That is equivalent to more than $860 billion annually in today’s economy. Unless we see a very sharp pickup in health care cost growth, the gap between the 1991 projection and actual spending in 2030 will be considerably larger.
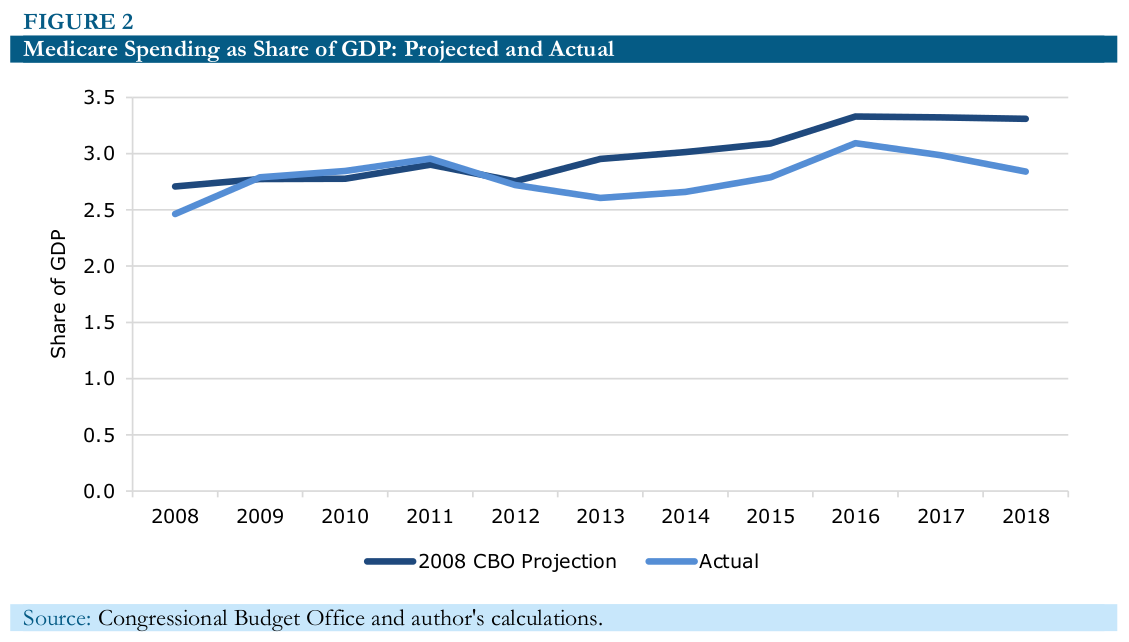
It wasn’t just the projections from the 1990s that proved to be overly pessimistic. There has been a sharp slowing in health care costs in just the last decade. In 2008, the CMS projections were for national health care spending to be 19.5 percent of GDP by 2017, a full 1.5 percentage points higher than the actual figure.[5] This can also be seen in the CBO projections for health care spending. CBO only projects the government side of health care spending, which is skewed by the expansion of Medicaid and the subsidies in the exchanges which were part of the 2010 Affordable Care Act. But if we just look at the Medicare projections, as shown in Figure 2, we can see that costs have risen considerably less rapidly than projected. Net spending for 2018 was 2.8 percentage points of GDP, nearly 0.5 percentage points less than the 3.3 percent of GDP that had been projected in 2008.
The reduction in Medicare cost growth can also be seen in the projections for the program’s financial health by the Medicare trustees. In the 2009 Medicare trustees report the projected shortfall in the program’s funding over its 75-year planning horizon was 3.88 percent of payroll.[6] In the most recent trustees report (2018) it was projected at 0.82 percent of payroll over its 75-year planning horizon.[7] Even this sharp reduction in the projected shortfall understates the improvement in the finances of the program since the 75-year horizon going forward from 2018 looks considerably worse demographically than the 75-year horizon going forward from 2009. Remarkably, this sharp improvement in the program’s finances has received little attention as the Obama administration opted not to publicize it to any substantial extent.
The Reason for High US Health Care Costs: We Pay Too Much
While the United States pays more than twice as much per person for its health care that people in most other wealthy countries, it is not because we get more or better health care. The United States actually does poorly by measures like life expectancy and infant mortality rates, but this is largely due to the fact that it has more inequality and higher poverty rates than most other wealthy countries. However, even when efforts are made to control for socioeconomic factors that affect health, the US healthcare system does not stand out as being an especially good system compared to those in other wealthy countries.[8] The basic story is that we pay twice as much for everything as other countries. This is true for doctors and dentists, for our drugs and medical equipment, and for the insurance industry that gets between patients and providers.
Doctors
Doctors in the United States get paid twice as much on average as physicians in other wealthy countries. This is not a general pattern throughout the economy. Our autoworkers and retail workers do not get paid twice as much as their counterparts in Germany and France. In fact, our autoworkers are likely to get paid considerably less than their counterparts in northern and western Europe.[9]By contrast, our doctors do get paid twice as much as their counterparts in Europe.
Our general practitioners get paid on average close to $200,000 a year, while specialists average close to $300,000, with the most highly paid getting $500,000 a year or more.[10] Our pay for physicians is further inflated by the fact that two-thirds of our doctors are specialists, while in most other countries the ratio would be close to one-third. These means that we have many specialists in the US who are doing tests and procedures that would be done by general practitioners in other countries.
The most obvious way to get physicians’ pay more in line with other wealthy countries is through increased competition, both foreign and domestic. In terms of foreign competition, we have very restrictive rules that largely prevent foreign-trained physicians from practicing in the United States. We require that they complete a US residency program in order to work as a physician in the United States. This means that even highly accomplished doctors in countries like France and Germany would be arrested if they practiced medicine in the United States.[11]
The obvious route for more competition would be to allow foreign doctors who have received comparable training to what US doctors receive to practice in the United States. We could also work to facilitate US patients going overseas to talk advantage of lower cost care directly, by having major non-emergency surgeries performed in other countries with lower costs. With the difference in price for major procedures often coming to $100,000 or more, there could still be large savings even if a patient traveled with a family member and stayed overseas for a lengthy period of recovery. To substantially increase medical travel, it would be necessary to have a reliable system of accreditation which would allow patients to have confidence in the quality of the facilities they are using. It would also be necessary to have well-defined rules on legal liability so that patients would know they have recourse in the event there is a mistake.
The potential gains from bringing the pay of US doctors in line with the average for other wealthy countries are large, in the neighborhood of $100 billion a year or roughly $700 per household per year. There are issues of equity that would come up if the pay of doctors were to fall sharply. Many have taken out large amounts of debt to pay for their medical training. Medical school in most other wealthy countries is mostly paid for by the government. It would be reasonable to follow the same path here and to have some loan forgiveness program to get doctors through the transition. However, it is worth noting in this context that there was very little interest in policy circles in measures that sought to compensate the millions of manufacturing workers who were displaced in the last decade by the opening of trade, especially to China. That is not a model we would want to emulate, but it is striking that there seems to be so much more interest in ensuring that our most highly educated workers are protected from the impact of foreign competition than was the case with less-educated manufacturing workers.
There also is an issue of increased domestic competition. There are many tasks that are now performed by doctors that can be performed equally well by less-highly trained and less-highly paid health care professionals. One area that has drawn considerable attention is prescribing drugs. In several states, nurse practitioners are able to prescribe drugs without a doctor’s supervision. There is no evidence that this leads to worse outcomes or increased incidence of drug abuse. Laws defining the scope of practice for various professionals should be based on medical evidence, not the desire of more highly paid professionals to increase their income.
Prescription Drugs
According to the OECD, the United States paid more than $1,200 per person for prescription drugs in 2017, whereas in other wealthy countries drugs cost close to $600 per person.[12] The basic story in the United States is that we give drug companies patent monopolies and then allow them to charge whatever they want for their drugs. In many cases, these drugs are necessary for people’s health or even their life. This means that if there is any way that a person or their family can pay the price demanded by the drug company, they will do so. Since the payer is typically a third party, either an insurer or the government, this means that they will spend their efforts lobbying an insurer or the government to pick up the tab.
Other wealthy countries have some process of negotiation whereby they restrict what drug companies can charge. This can mean, in some cases, that expensive drugs that are available in the United States, are not available in the United Kingdom or Australia, because their governments were not able to reach an agreement on price with the drug company. However, in most cases, the drugs are available and the price is typically around 50 percent of the price in the United States. (There is a similar story with medical equipment. Items like MRIs typically cost around half as much in other wealthy countries as in the United States.)
There are two routes to go to bring our prices in line with those in other wealthy countries. The first is to adopt the same sort of negotiation process used elsewhere. The pharmaceutical industry will use all its power to prevent a reduction in prices in the United States since the country is such a large source of profits for the industry. However, if the political obstacles can be overcome, there is no reason why people in the United States have to pay twice as much for drugs as people in France and Germany.[13]
The other route is to look to replace the research supported by patent monopolies with public funds. In this scenario, the government would look to replace the roughly $70 billion a year that the industry now spends on research with additional public funding. (The government already spends roughly $40 billion a year on biomedical research through the National Institutes of Health and other agencies.)
Ideally, the government would sign long-term contracts with drug companies to conduct research in various areas. A condition of getting a contract would be that all results are in the public domain. This means both that all patents are placed in the public domain and also that all results are posted on the Internet as soon as possible so that they can be reviewed and critiqued by other researchers.[14]
The potential savings from going this route are enormous. In 2018, the United States spent almost $440 billion (2.2 percent of GDP) on prescription drugs. It is likely that these drugs would have cost less than $80 billion (0.4 percent of GDP) in a free market where all drugs are sold as generics. Drugs are rarely costly to manufacture; their high prices stem from the protection the government gives them.
In addition to drastically reducing the cost of drugs, this route would also eliminate many of the perverse incentives created by patent monopolies. Drug companies would no longer spend billions of dollars on lobbying and legal fees trying to protect and extend their patent monopolies because these monopolies would no longer exist. They would also have much less reason to advertise and market their drugs to doctors since their profit margins would be more comparable to what companies get from selling paper cups rather than street heroin. And, they would have much less reason to conceal evidence that drugs are less effective than originally believed or that they could be dangerous under some circumstances.
The same story would apply to all sorts of medical equipment and tests. If an MRI were just a few hundred dollars, doctors would have little concern about prescribing one for a patient if they believe that it would be more effective than a less expensive scanning device. As with drugs, the cost of researching the device has already been paid. In almost all cases, the cost associated with additional use is likely to be trivial.
Insurance Costs
We paid private insurers almost $230 billion (1.2 percent of GDP) in 2017 to administer insurance plans. Most of this money was paid to administer private insurance plans either purchased by employers or individuals.[15] This means that administrative costs were more than 19 percent of the $1,183 billion that insurers paid for services in that year.[16] By comparison, Medicare’s administrative expenses are a bit more than 2.0 percent of what it pays out for services each year. Canada has comparable administrative expenses for its universal Medicare program.
In addition to the direct expense of supporting the insurance industry, the fact that we have multiple insurers with varying policies on coverage, copays, and deductibles, means that hospitals and doctors’ offices must have more staff to deal with billing. If we had a single Medicare-type insurer, as in Canada and a number of other countries, providers could get by with considerable less office staff to deal with the financial aspects of health care.
This change would also likely be a big boon to patients since insurers often make mistakes in not paying for covered care. (They likely make some mistakes in the other direction as well, but this would not be a major source of aggravation for people in bad health or their families.) If the payment structure was simplified, it would drastically reduce the amount of time wasted on all sides in dealing with health care bills.
It is difficult to get a clear sense of what the total savings would be from a simplified insurance system, but a figure in the neighborhood of $140 billion a year (0.7 percent of GDP) would likely be in the ballpark. Some of these savings could likely be accomplished with an expanded Medicare-type system that people could buy into voluntarily. Since getting to a universal Medicare system all at once is likely a hurdle too big, we will almost certainly need some intermediate steps if we are to go in this direction.
Conclusion: Health Care Costs and Budget Deficits Can Be Controlled
The projections of escalating budget deficits are overwhelmingly a story of high US health care costs. If US health care costs were comparable to those in other wealthy countries, our current and projected future deficits would be easily manageable.
Even though we pay twice as much per person as people in other wealthy countries, we do not get better health care for our money. The problem is that we pay twice as much to our doctors, for our drugs and medical equipment, and we waste a huge amount of money administering private insurance. If we can get these costs more in line with those in other wealthy countries, we will save an enormous amount of money on our health care and we will not have deficit problems to worry about.
Notes.
[1] This calculation assumes that the ratio of spending in Germany to spending in the United States remains constant over the next 30 years. The calculation also assumes that interest rates will be the same in the lower health care cost scenario. Interest payments will be lower in the lower health care cost scenario only because debt is lower, the calculation does not assume that lower debt and deficits result in lower interest rates. This assumption almost certainly leads to an understatement of the savings from lower health care costs. The calculation also understates the savings from lower health care cost since it doesn’t pick up the additional tax revenue that the government would realize as a result of private sector health care spending. The health insurance premiums that employers pay for their workers are not subject to income tax. If the savings from lower health care costs showed up as higher wages, as is generally assumed, it would increase tax revenue by roughly 1.0 percent of GDP or $200 billion in 2019.
[2] These data are taken from the OECD’s data page for per capital health care spending, see: OECD. 2019. “Health Spending (Indicator).” Paris, France: OECD. https://data.oecd.org/healthres/health-spending.htm#indicator-chart.
[3] “Exhibit 1: National Health Expenditures, By Type of Service, Middle Scenario, Selected Calendar Years 1980–2030” in Waldo, Daniel R., Sally T. Sonnefeld, Jeffrey A. Lemieux, and David R. McKusick. 1991. “Health Spending Through 2030: Three Scenarios.” Health Affairs, Vol. 10, No. 4, p. 234. https://www.healthaffairs.org/doi/pdf/10.1377/hlthaff.10.4.231.
[4] Centers for Medicare and Medicaid Services. “Table 1: National Health Expenditures and Selected Economic Indicators, Levels and Annual Percent Change: Calendar Years 2010–2026.” Baltimore, MD: Centers for Medicare and Medicaid Services. https://www.cms.gov/Research-Statistics-Data-and-Systems/Statistics-Trends-and-Reports/NationalHealthExpendData/Downloads/Proj2017Tables.zip.
[5] Sean Keehan, Andrea Sisko, Christoper Truffer, Sheila Smith, Cathy Cowan, John Poisal, and M. Kent Clemens. 2008. “Health Spending Projections through 2017: The Baby-Boom Generation is Coming to Medicare.” Health Affairs, Vol.. 27, No. 2, pp. 145–155. https://www.ncbi.nlm.nih.gov/pubmed/18303038.
[6] OASDI Board of Trustees. 2009. “2009 OASDI Trustees Report.” Woodlawn, MD: Social Security Administration. https://www.ssa.gov/oact/tr/2009/VI_OASDHI_payroll.html#131183.
[7] Boards of Trustees of the Federal Hospital Insurance and Federal Supplementary Medical Insurance Trust Funds. 2018. “2018 Annual Report of the Boards of Trustees Of the Federal Hospital Insurance and Federal Supplementary Medical Insurance Trust Funds.” Baltimore, MD: Centers for Medicare and Medicaid Services. https://www.cms.gov/Research-Statistics-Data-and-Systems/Statistics-Trends-and-Reports/ReportsTrustFunds/downloads/tr2018.pdf.
[8] For example, see: Schneider, Eric C., Dana O. Sarnak, David Squires, Arnav Shah, and Michelle M. Doty. 2017. “Mirror, Mirror 2017: International Comparison Reflects Flaws and Opportunities for Better US Health Care.” New York, NY: Commonwealth Fund. https://interactives.commonwealthfund.org/2017/july/mirror-mirror/.
[9] Bureau of Labor Statistics. 2012. “Table 1. Hourly compensation costs, US dollars and US = 100.” Washington, DC: Bureau of Labor Statistics. https://www.bls.gov/news.release/ichcc.t01.htm.
[10] Knowles, Megan. 2017. “AMGA: 10 median salaries by medical specialty.” Becker’s Hospital Review, November 13.https://www.beckershospitalreview.com/compensation-issues/amga-10-median-salaries-by-medical-specialty.html.
[11] Doctors licensed in Canada are exempted from the residency requirement, although other restrictions still make it difficult for them to practice in the United States.
[12] OECD. 2019. “Pharmaceutical Spending (Indicator).” Paris, France: OECD. https://data.oecd.org/healthres/pharmaceutical-spending.htm.
[13] The industry will claim that this will reduce their research spending. This is undoubtedly true to some extent, but if we get slightly less research, and save $200 billion a year on drugs, that might look like a pretty good trade-off.
[14] Copyleft patents may prove to be more desirable than simply putting material in the public domain. In principle, all countries would share in the cost of biomedical research according to a formula based on their size and wealth. However, if some countries refused to go along with such an agreement, then a copyleft patent could deny them free access to the research.
[15] Insurers also play a role in administering Medicare, especially with Medicare Advantage plans.
[16] These are taken from Centers for Medicare and Medicaid Services. 2019. “National Health Expenditures Projections, Tables 1 and 3.” Baltimore, MD: Centers for Medicare and Medicaid Services. https://www.cms.gov/Research-Statistics-Data-and-Systems/Statistics-Trends-and-Reports/NationalHealthExpendData/Downloads/Tables.zip.
This article is adapted from a presentation at the Middlebury Institute, Monterey, CA. It originally appeared on CEPR.
