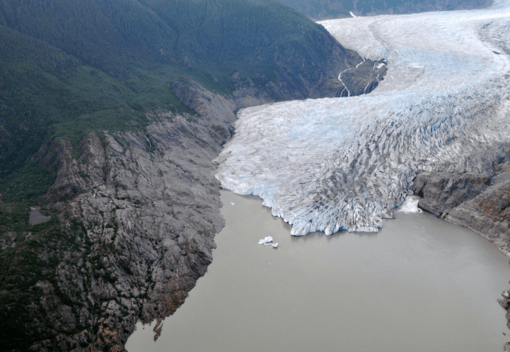
Photo by U.S. Department of Agriculture | CC BY 2.0
Ten years ago Kevin J. Surace delivered a fascinating TED talk entitled “Worst Case Climate Change.”
Based upon credits at the end of his speech, data for his talk came from the following sources:
– Fred Pearce, With Speed and Violence: Why Scientists Fear
– Tipping Points in Climate Change (Beacon Press, 2007)
– John D. Cox, Climate Crash Abrupt Climate Change and What It
– Means for Our Future (John Henry Press imprint of the National Academies Press, 2005)
– Reviewed by Dr. Anthony Strawa atmospheric scientists, NASA.
Mr. Surace’s brilliant summation Worst Case Climate Change, as of 2008, was done for purposes: (1) exposure, (2) making the issue controversial, and (3) to make people think about the prospects. He did not intend to suggest the worst case would happen, rather encouraging people to learn more and act accordingly.
Ten years later, how does Surace’s TED talk hold up?
Unfortunately explained herein his “Worst Case” scenario hasn’t missed a beat, and maybe worse than expected. Sorrowfully, head held downward, his thesis holds up!
Still, there’s a hidden trick found within this subject matter. Worst Case Climate Change consists of negative changes not seen in everyday life, other than climate scientists, and therefore it is difficult, if not impossible, for ordinary people to understand the gravity of this situation. After all, who lives in Antarctica or the Arctic or in the ocean? Nobody. Meantime, by the time the brutal aftereffects become evident, it’s already “lights out!”
Surace’s approach to the subject utilized Intergovernmental Panel on Climate Change (IPCC) data for comparison/contrasting purposes. As referenced therein, more or less, the IPCC used a linear or straight-line methodology. However, by way of contrast, in the real world “discontinuities” (non-linear) are common throughout climate history and throughout nature, thus suggesting the IPCC model too conservative in approach and in conclusion.
Carbon Dioxide- CO2
Surace starts his talk with a remarkable statistic that seems simple enough, but it is filled with a powerful haunting message, i.e., CO2 or carbon dioxide in the atmosphere under 300 ppm for 40,000 years. But, all of a sudden, within the geologically short time frame of 200 years, it is “now at 387 ppm,” circa 2008, thus insinuating that the Goldilocks climate” not too hot, not too cold” throughout human history may be a thing of the past.
That fact alone is consummately important and warrants attention beyond the stating of mere numbers because each 1-ppm molecular increase of CO2 has bigger and bigger and bigger impact on global warming, similar to adding individual layers of woolen blankets onto somnolence. Enough blankets added and even an enormous gargantuan perfectly round-faced fading-blue grimacing planet sweats bullets.
Whereas as of May 2, 2018 the Scripps Institution of Oceanography Mauna Loa Observatory/Hawaii reading for atmospheric CO2 registers 408.90 ppm, still climbing higher and higher, year-by-year, thus adding heavier, thicker woolen blankets to an increasingly achromatic Mother Earth. The logical upshot is a hotter and hotter much hotter planet, kinda like a yet-to-be-born baby Venus (864F), where the atmosphere is so thick with CO2 that it can be cut with a knife, which would melt in an instant.
Atlantic Meridional Overturning Circulation
Thereafter, Surace segues into one of the most far-reaching, yet least understood, aspects of climate change/global warming, the North Atlantic Flow, an ocean conveyor belt named Atlantic Meridional Overturning Circulation (AMOC) that keeps Europe warm. Without AMOC grinding away, moving unbelievable tonnage of water throughout the world’s seas, Europe would be ice-covered.
According to Surace’s research, thousands of years ago, within only 10 years, the conveyor belt (AMOC) shut down very quickly. Results: Europe cooled by 5F within a several years and glaciers overwhelmed Northern Europe.
Per his speech, according to NASA, since 1990, North Flow is down 30% and South Flow down 50%. Regrettably, IPCC Models did not mention this climacteric risk factor. Once again, demonstrating inherent weaknesses with IPCC overall methodology.
Here’s what recent up-to-date science, as of 2018, has discovered about the Atlantic Meridional Overturning Circulation (AMOC): “The AMOC is in a very weakened state—the most anemic it has been in the last 1,600 years.” (Source: Andrea Thompson, Slow-Motion Ocean: Atlantic’s Circulation Is Weakest in 1,600 Years, Scientific American, April 11, 2018)
Therein lay the world’s greatest paradox as global warming impacts worldwide temps whilst possibly casting a cold spell over Europe. Which side wins?
Arctic
Headed northward, Surace set sights on the Arctic, showing a graph of actual Arctic melt vs. IPCC models. Whereas IPCC models suggested the Arctic would melt by 2100, NASA satellite data thru 2007 indicated that the North Pole ice melt was falling off a cliff, way below IPCC projections, and could complete “by 2017, or so.”
As of August 17, 2017 U.S. Naval Research Lab measurements of Arctic sea ice over a 30-day period “shows that the multi-year sea ice has now virtually disappeared.” (Source: Storms over Arctic Ocean, Arctic News, August 19, 2017)
Multi-year ice was formed over thousands of years and constitutes, or rather constituted, the infrastructure for the North Pole.
This means the Arctic has lost its infrastructure. It’s gone. Yes, ice still forms during wintertime with no sunlight 24/7, but it is thin and almost meaningless, which can lead to untold horrific consequences of radical climate change throughout the Northern Hemisphere, throwing humanity into a tailspin, a tizzy of despair, social unrest, and starvation. The reasons are multifold and too broad to tackle herein, but the consequences down the road are brutal!
Greenland
Regarding Greenland, the giant ice sheet experiences loss of ice every year, ever since 1980. It is melting, and the especially bad news is the rate of melt is accelerating. As of 2008, cumulative acre-feet loss equals 3-4 billion acre-feet, an amount that would cover the entire US with two feet of ice.
As for an updated (2017) analysis of Greenland ice melt: Previously “Glaciologists were already fully occupied trying to track and forecast the surge in glacial calving. Now, they are striving to understand the complex feedbacks that are speeding up surface melting.” (Source: Eli Kintisch, The Great Greenland Meltdown, Science, February 23, 2017)
The big melt-off is accelerating because of unseasonably warm summers as well as microbes and algae, soot and dust that blow from lower latitudes and darken the ice, collecting on the white, shiny Greenland ice, thus absorbing rather than reflecting solar energy.
Greenland is living up to, in fact beyond, Surace’s expectations from a decade ago. Nightmarishly, the big chunk of ice contains over 20 feet of sea level rise.
Antarctica
Speaking of “living up to expectations,” Antarctica is flat-out losing it, but first Surace’s comments of a decade ago: Larsen B ice shelf in Antarctica is an example of something happening much quicker than we thought. Within days in 2002, the large ice shelf crashed, splintering into the water. The ice shelf was 12,000 yrs old and 650 feet thick, 100 square miles.
The IPCC model suggested Larsen B would last thousands of years, but remarkably, it broke up and crashed in 3 short days. Trouble is: It’s the “cork” holding back land-based glacial ice. That cork is out of the bottle, which will accelerate Antarctica ice flow to the sea. Ouch!
Historically, as recently as 1979 Pine Island Ice Shelf and Thwaites Ice Shelf were status quo for decades, not much change. Then, things suddenly went haywire, changing very rapidly, to wit:
1995- Losing 70M-acre feet/yr
2006- Losing 220M-acre feet/yrly – an astounding annualized rate.
Notice the remarkable pick up in acceleration over 11 years. That’s bad news.
According to Surace, for perspective purposes, Pine Island and Thwaites have been in place millions of years, but are now (2008) melting and thinning at record pace. It they collapse, 6 feet sea level rise. Not only that, NASA spotted a weak underbelly in recent (2007-08) radar images.
Accordingly, in 2008, the British Antarctica Survey estimated: “Thwaites is in danger of imminent collapse.”
No collapse models were found in the IPCC model, as of 2008, only expecting slow melt over time. Unfortunately, behind Thwaites is the West Antarctica Ice Sheet, and if that collapses, sea levels up 18 feet.
IPCC Models, as of 2008, show nothing about this risk to such a vast extent.
Heavens to Betsy! Surace was conservative about Antarctica. July 12, 2017, the Larsen C Ice Shelf crashed, a trillion-ton iceberg, fundamentally changing the landscape of the Antarctic Peninsula. As a result, National Geographic will have to redraw the World Atlas.
The recent tally of ice shelf collapses:
1995- Larsen A Ice Shelf collapses
20o2- Larsen B Ice Shelf splinters and collapses
2017- Larsen C Ice Shelf falls apart
Problem is… the ice shelves, which extend over water, serve as giant buffers, holding back the flow of inland glaciers where the real serious ice flow originates, like a hockey goalie stopping pucks. Hopelessly, it must be late in the game, as Antarctica’s gone Full Monty without its goalie.
Paleoclimate Perspective
For a broader perspective, Surace segues to a discussion of the paleoclimate record, painting a most interesting picture of climate change over millennia:
1) 3M years ago: sea level was 75 feet higher than today with CO2 at 400 ppm and only 3 degrees warmer than 2008. The reason 75 feet higher back then, and not today with similar CO2 levels, it happened gradually, over centuries, not over decades, like today.
2) 20,000 yrs ago- 400 feet lower sea level and CO2 was 200 ppm.
Thereby proving that CO2 levels in the atmosphere directly impact sea levels.
The Amazon
Amazon Rain Patterns are changing as atmospheric warming shifts rain away from the Amazon. As a result, multiple droughts are taking a toll on overall growth. In point of fact, only 3-5 years of severe drought kills most trees.
For point of reference, Amazonian trees store 77B tons of CO2 which equals 20 yrs of manmade CO2. But, when trees die and during forest fires, CO2 is released back into the atmosphere. This is happening today (2008), but not factored into the IPCC model.
Here’s an Amazon update, as referenced in National Geographic: “In the time it takes to read this article, an area of Brazil’s rainforest larger than 200 football fields will have been destroyed. The market forces of globalization are invading the Amazon.”
Especially bad news as “the world’s lungs” take one hit after another. That wunderkind of nature experienced unprecedented back-to-back-to-back severe droughts, 2005, 2010, and 2016, unheard of throughout geologic history. This one fact alone is worthy of ringing the bell at the public square, “all hands on deck.”
Permafrost
Ancient permafrost stores tons and tons of methane in Siberia, but it is already releasing 50M tons per year equivalent to 1B tons of CO2. Sorrowfully, methane release is rapidly accelerating since average temps now run 32F. In fact, the entire Siberian region is on the verge of collapse. According to Surace, here’s the problem: If it all melted or collapsed, it would add 30F to average earth temps, scorching agricultural crops into blackened brittle stems.
IPCC models make no assumptions about this. But, according to Surace, it is already happening.
Here’s guessing that Surace would be shocked, knees folding under, by the current status of Arctic methane. Again, this is a non-populated area, and that’s a good thing, as it’s coming apart at the seams. For example, Russian scientists have already, as of 2018, discovered 7,000 Siberian pingos, mounds containing mucho methane. Vladimir Romanovsky, geophysist at University of Alaska, estimates there could be as many as 100,000 pingos across the Arctic permafrost.
Furthermore, Surace would likely drop to his knees upon hearing another latest: Recent measurements in Alaska show biological sources alone emitting 220M tons of GHG over a two-year time period, which is equivalent to all U.S. commercial emissions per annum. In short, the planet’s ecosystem is now competing with humans in GHG emissions, or in other words, if humans dropped dead, the planet will self-feed greenhouse gases into the atmosphere in an anomalous fashion, meaning not normal, not natural, incipient Runaway Global Warming. That news should take Surace down to his knees and prostrate him onto the ground.
Oceans
According to Surace, the oceans are changing dramatically, but that may be an understatement. For eons, the ocean served as a CO2 sink, but it has probably absorbed all it can. Since 1850 it has absorbed 130B tons of CO2 from humans. Nowadays, according to Surace, it’s more acidic and nearly maxed-out as carbon sink. According to him, over time, the ocean could become a source of CO2, similar to what’s happened on land in Alaska only recently. Once again, the IPCC models forget to calculate this threat.
An update, as of 2018, too much CO2, too much heat, and too much acidification in the oceans would require an additional 100-page article. It’s that bad!
Methane Clathrates at Bottom of Ocean
Surace discussed a paleoclimatic event 55M years ago, clathrates (containing frozen methane over the eons) broke open and ocean temps rose a few degrees, shattering clathrates over the following 10 years, as temps rose 18F very rapidly leading to mass extinction. That happened millions of years ago.
IPCC models do not include mention of clathrates.
As of 2018, Russian scientists in conjunction with Americans have identified massive quantities of methane releasing into the atmosphere in the Arctic, especially around the East Siberian Arctic Shelf where waters are only 50 metres deep.
The world’s foremost authority on the region, Dr. Natalia Shakova, stated: “As we showed in our articles, in the ESAS (East Siberian Arctic Shelf), in some places, subsea permafrost is reaching the thaw point. In other areas it could have reached this point already. And what can happen then? The most important consequence could be in terms of growing methane emissions… a linear trend becomes exponential. This edge between it being linear and becoming exponential is very fine and lies between frozen and thawed states of subsea permafrost. This is what we call the turning point…. Following the logic of our investigation and all the evidence that we accumulated so far, it makes me think that we are very near this point. And in this particular point, each year matters. This is the big difference between being on the linear trend where hundreds and thousands of years matter, and being on the exponential where each year matters.” (Source: Nature Communication Journal, Current Rates and Mechanisms of Subsea Permafrost Degradation in the East Siberian Arctic Shelf, Article No. 15872 June 22, 2017.
When Dr. Shakova mentions “exponential versus linear,” she references an astounding fact, to wit: Thirty (30) linear steps to the water cooler across the room would be equivalent, if 30 exponential steps, to circumnavigation of the planet. That’s exponential. That’s a nightmare scientists like Dr. Shakova live with.
Stern Report for British Government
Finally, Sucrea mentions the Stern Report to the British government, assessing the worst case. Assuming worst-case scenario, here’s their list of outcomes ten years ago:
– Sea rise 15-20 feet in few decades
– Underwater Florida, NYC, Monterey, London, Toky0
– 1B people displaced, sick and/or dead
– Massive water and food shortages
– $20T worldwide damages
– Food and water wars.
Amazingly and fascinatingly, all of the climate events mentioned above occur where people do not live, do not see, and do not sense the danger. But, significantly, they are happening right now.