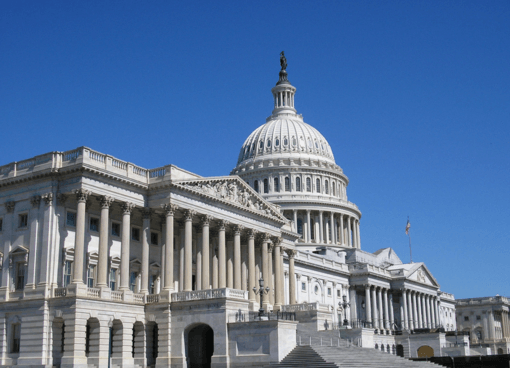
Photo by Upendra Kanda | CC BY 2.0
In order to take back the House of Representatives in November 2018, Democrats will almost certainly have to run the table in 40 competitive contests, none of which currently suggest certain or near certain Democratic wins. Democrats could, in a reasonably realistic scenario, win all 40 of the races in the first chart below and find themselves in a virtual stalemate with a razor thin 218-217 advantage over House Republicans. In such a situation, illness, death, incapacity, resignation, party switching, or failure to reach absolute party unanimity on any particular issue could mean continuing GOP control over fundamental decision making in all three branches of national government.

As indicated in the chart, twenty-six of the 40 are seats currently or most recently held by Republicans. Fourteen are seats held by Democrats where their most recent margin of victory was less than six percentage points, Donald Trump garnered more votes in the district than Hillary Clinton, or both. In two of the fourteen races in currently blue constituencies (NV-03, NH-01), the Democratic incumbent won in 2016 by less than a point and a half, Trump won more votes than Clinton, and the incumbent is not standing for re-election.
The fourteen currently projected toss-ups include eleven seats currently or most recently held by Republicans and three by Democrats. The eighteen D-Lean seats break down into twelve currently held by the GOP and six by Dems. Of six D-Likely seats, five are currently held by team blue, one by team red. Recently, the Pennsylvania Supreme Court overturned a highly GOP favorable gerrymander with a new map that would mean at least one currently GOP seat would likely moved to the blue column as Hillary Clinton won more votes than Trump in the newly redrawn boundaries. Another seat, as redrawn, is a voting district Clinton would have claimed by 28%. It is marked D-Safe with an asterisk noting that Republicans have filed appeals at the federal level both in district court and directly to the U.S. Supreme Court.
All told, Democrats could compete for as many as seven newly redrawn Pennsylvania districts. That number may reduce to six after Tuesday, March 13. While I am not making a formal forecast for PA-18’s special election, the four active pollsters have, once again, over polled highly educated Pennsylvanians as compared to the general population. Where PA-18 as currently drawn includes just 33% of voters with a four-year college degree or greater, the four pollsters in the field (Gravis, Raba, Emerson, and Monmouth) have projected a likely voter field with an average of 48% college educated voters. The redrawn PA-18 (now PA-14) is even more likely to vote Republican according to a New York Times analysis (a 20% voting advantage for Trump over Clinton in 2016 versus what would be a 29% advantage as currently constituted).
Those additional twenty races (including PA-18 as redrawn to PA-14), identified in a further chart below, are races where Democrats could conceivably eek out wins in a larger “blue wave” situation, namely a double digit win in the overall popular vote. My current projection puts Democrats at an 7.1% advantage in averaging the national figures for generic congressional vote (e.g. “If the election scheduled for November were held today, would you vote for the Democrat or Republican in your district for House of Representatives?”). Currently there are 241 seats currently or most recently held by Republicans and 194 by Democrats. Even with a large 7-10 point Democratic win, Republicans have a strong built-in advantage. They carry with them the power of incumbency (a 2.5-3.5% bump) and have gerrymandered dozens of states heavily in their favor while controlling state governments during redistricting efforts after the 2010 census. The well-known phenomena of a President’s party losing many seats at mid-term elections, notwithstanding, it seems unlikely that Democrats will sweep to decisive victory without a major change in fortunes over the next eight months.
At a more detailed level, one can se why this is the case. Republicans won the national vote in terms of House races 49.1-48.0 or by 1.1% in 2016. This is the number that corresponds with the “generic congressional ballot” polling numbers. If Democrats move the needle by 8.2% nationally in their direction to a 7.1% advantage rather than a 1.1% loss, the basic assumption is that this movement would be somewhat evenly distributed across races, likely fairly larger where there is not an incumbent running, a decent bit smaller in the vast majority of races involving an incumbent that remains popular in their own district. So in places where the incumbent Republican won by double digits but is not running again in 2018, for example FL-27 (10% win in 2016 for the GOP) NJ-11 and WA-08 (19% and 20% GOP wins respectively), we would look for larger movement than 8.2% in favor of Democrats, particularly as Clinton outpolled Trump FL-27 by 20%, by 3.0% in WA-08, and there was a virtual tie in NJ-11 (0.8% pro-Trump).
These initial forty races should be considered must wins. For every seat Democrats lose in these forty winnable contests, they would be required to win a more difficult race in the next twenty races, or in even tougher contests elsewhere, to have a chance at a bare majority. Almost inconceivably, the Democratic Congressional Campaign Committee (DCCC) intentionally released opposition research late in February against one of its own primary candidates in one of the critical forty races (TX-07)

Democrats are already very unlikely to win back the Senate according to recent polling. While much could change between now and November, including especially a significant downturn in the stock market or an indictment of a Trump family member by Robert Mueller, Democrats have a much less than 50% chance of taking back the House in November unless they, or events beyond their control, can turn things significantly in their favor between now and then.